Figure 3. Results of genome-wide association study in canine cone-rod dystrophy 3. The statistical signal (y-axis, negative Log10 [Fisher
exact test 2-tailed probability]) for association between canine single-nucleotide polymorphism (SNP) genotype and canine
cone-rod dystrophy 3 (crd3) phenotype, plotted against SNP chromosomal location (A), demonstrates a distinct peak on canine chromosome 16 (CFA16). Green dots are SNPs for which the association signal exceeded
the Bonferroni threshold for genome-wide significance. Chromosome X is represented by the numbers 39 and 40. Homozygosity
analysis of SNP genotypes (B), in the region of CFA16 yielding the peak association signal, reveals heterozygosity throughout the interval in 21 nonaffected
control dogs, and demonstrates a 2.74 Mb homozygosity block in 20 crd3-affected dogs. Genotypes are color coded as follows:
pink and green represent the major and minor genotypes observed in affecteds, respectively; yellow is heterozygous; and white
is missing data. Black lines border the 2.74 Mb homozygosity block. Refseq genes screened as potential positional candidates
for crd3 in the present study (arrowheads), and ADAM family genes identified within the crd3 minimal linkage disequilibrium
interval (arrows) are indicated with annotation and order consistent with the CanFam2 canine genome assembly (C, not drawn to scale).
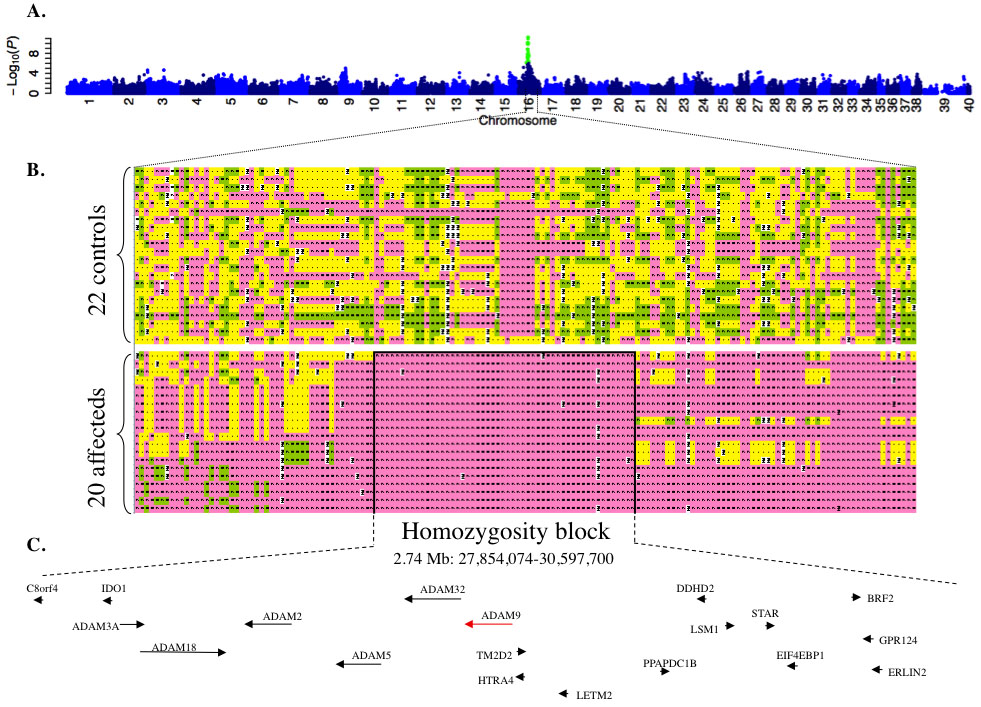
 Figure 3 of
Goldstein, Mol Vis 2010; 16:1549-1569.
Figure 3 of
Goldstein, Mol Vis 2010; 16:1549-1569.