Figure 1. Immunocytochemical localization analysis of AQP expression in corneal cell lines. The panels show (A) AQP1 expression (red) in HCEC cells, (B) Z-sectioning analysis showing AQP5 expression (green) in CEPI17 cells, and (C) Z-sectioning analysis showing AQP5 expression (green) in Primary WT CEPI cells. TIRF microscopic analysis showing the membrane
association of AQP5 in CEPI17 cells is seen in panel D.
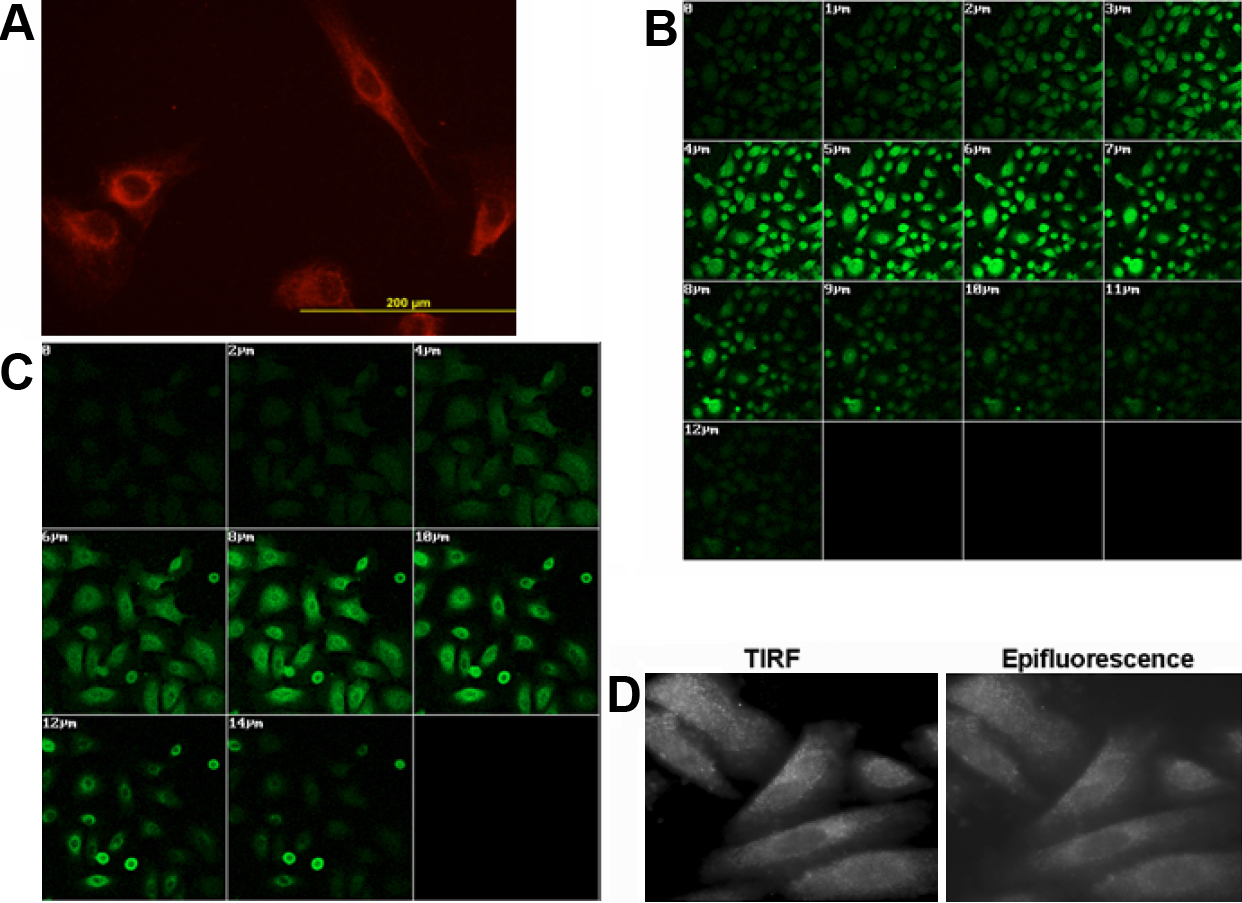
 Figure 1 of
Shankardas, Mol Vis 2010; 16:1538-1548.
Figure 1 of
Shankardas, Mol Vis 2010; 16:1538-1548.