Figure 5. Immunodetection of glucose derived AGEs in the soluble portion of lens protein. A: Representative western blot profile of soluble lens protein probed with anti-AGE-BSA antibodies. Lane 1: Molecular weight
markers, Lane 2: Group I, Lane 3: Group II, Lane 4: Group III, Lane 5: Group IV. B: Densitometry analysis of AGE-BSA. Intensity of AGE-BSA signals was quantified considering the intensity of lane 2 in upper
panel as 100%. Data in lower panel are mean±SEM of three independent experiments and different superscripts denote that data
are significantly different among the groups.
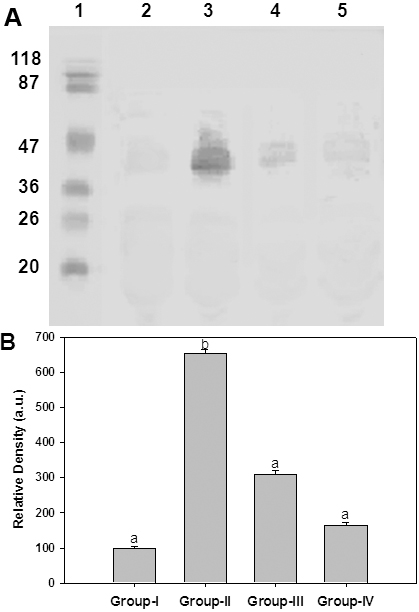
 Figure 5 of
Saraswat, Mol Vis 2010; 16:1525-1537.
Figure 5 of
Saraswat, Mol Vis 2010; 16:1525-1537.