Figure 4. Sub unit profile and protein
cross-linking of soluble fraction of lens. A: Soluble protein
was loaded onto a 12% polyacrylamide gel under reducing conditions.
Molecular weight standards in kDa are indicated alongside of the gel.
Lane 1- Molecular weight markers; Lane 2 - Group I; Lane 3 - Group II;
Lane 4 - Group III; Lane 5 - Group IV. B: Densitometric
quantification of cross links. Data are mean±SD (n=4). Intensity of
protein bands above 31 kDa was quantified considering the
intensity of Group I as 100%. Different superscripts above the bars
denote that data are significantly different among the groups.
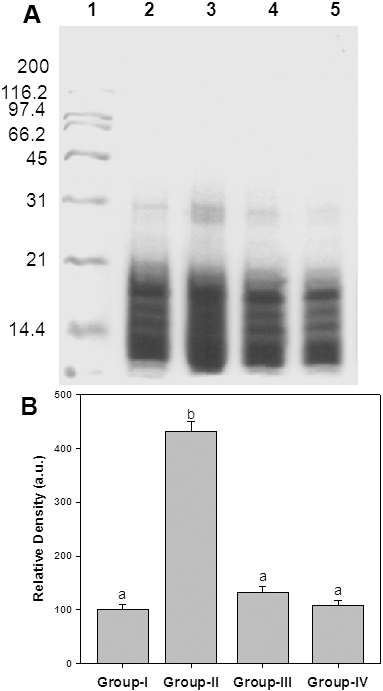
 Figure 4 of Saraswat, Mol Vis 2010; 16:1525-1537.