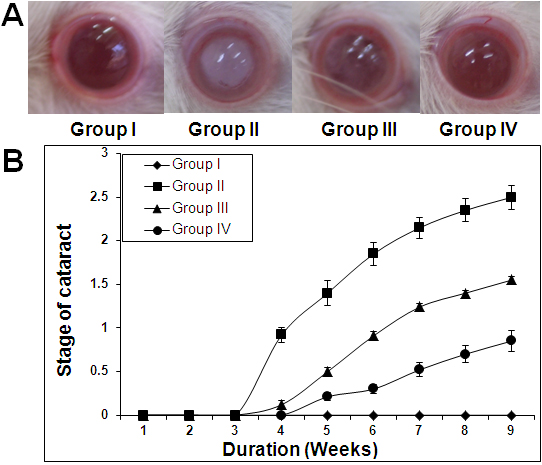
Figure 1. Delay of diabetic cataract in rats by ginger. A: Representative photographs of lens from each group at the end of 9 weeks. B: Quantitative representation of cataract progression in each group with time. Stage of cataract in each group was averaged
at a given time and the average stage of cataract along with standard error was plotted as a function of time.

 Figure 1 of
Saraswat, Mol Vis 2010; 16:1525-1537.
  Figure 1 of
Saraswat, Mol Vis 2010; 16:1525-1537.