Figure 7 of
Kutty, Mol Vis 2010; 16:1475-1486.
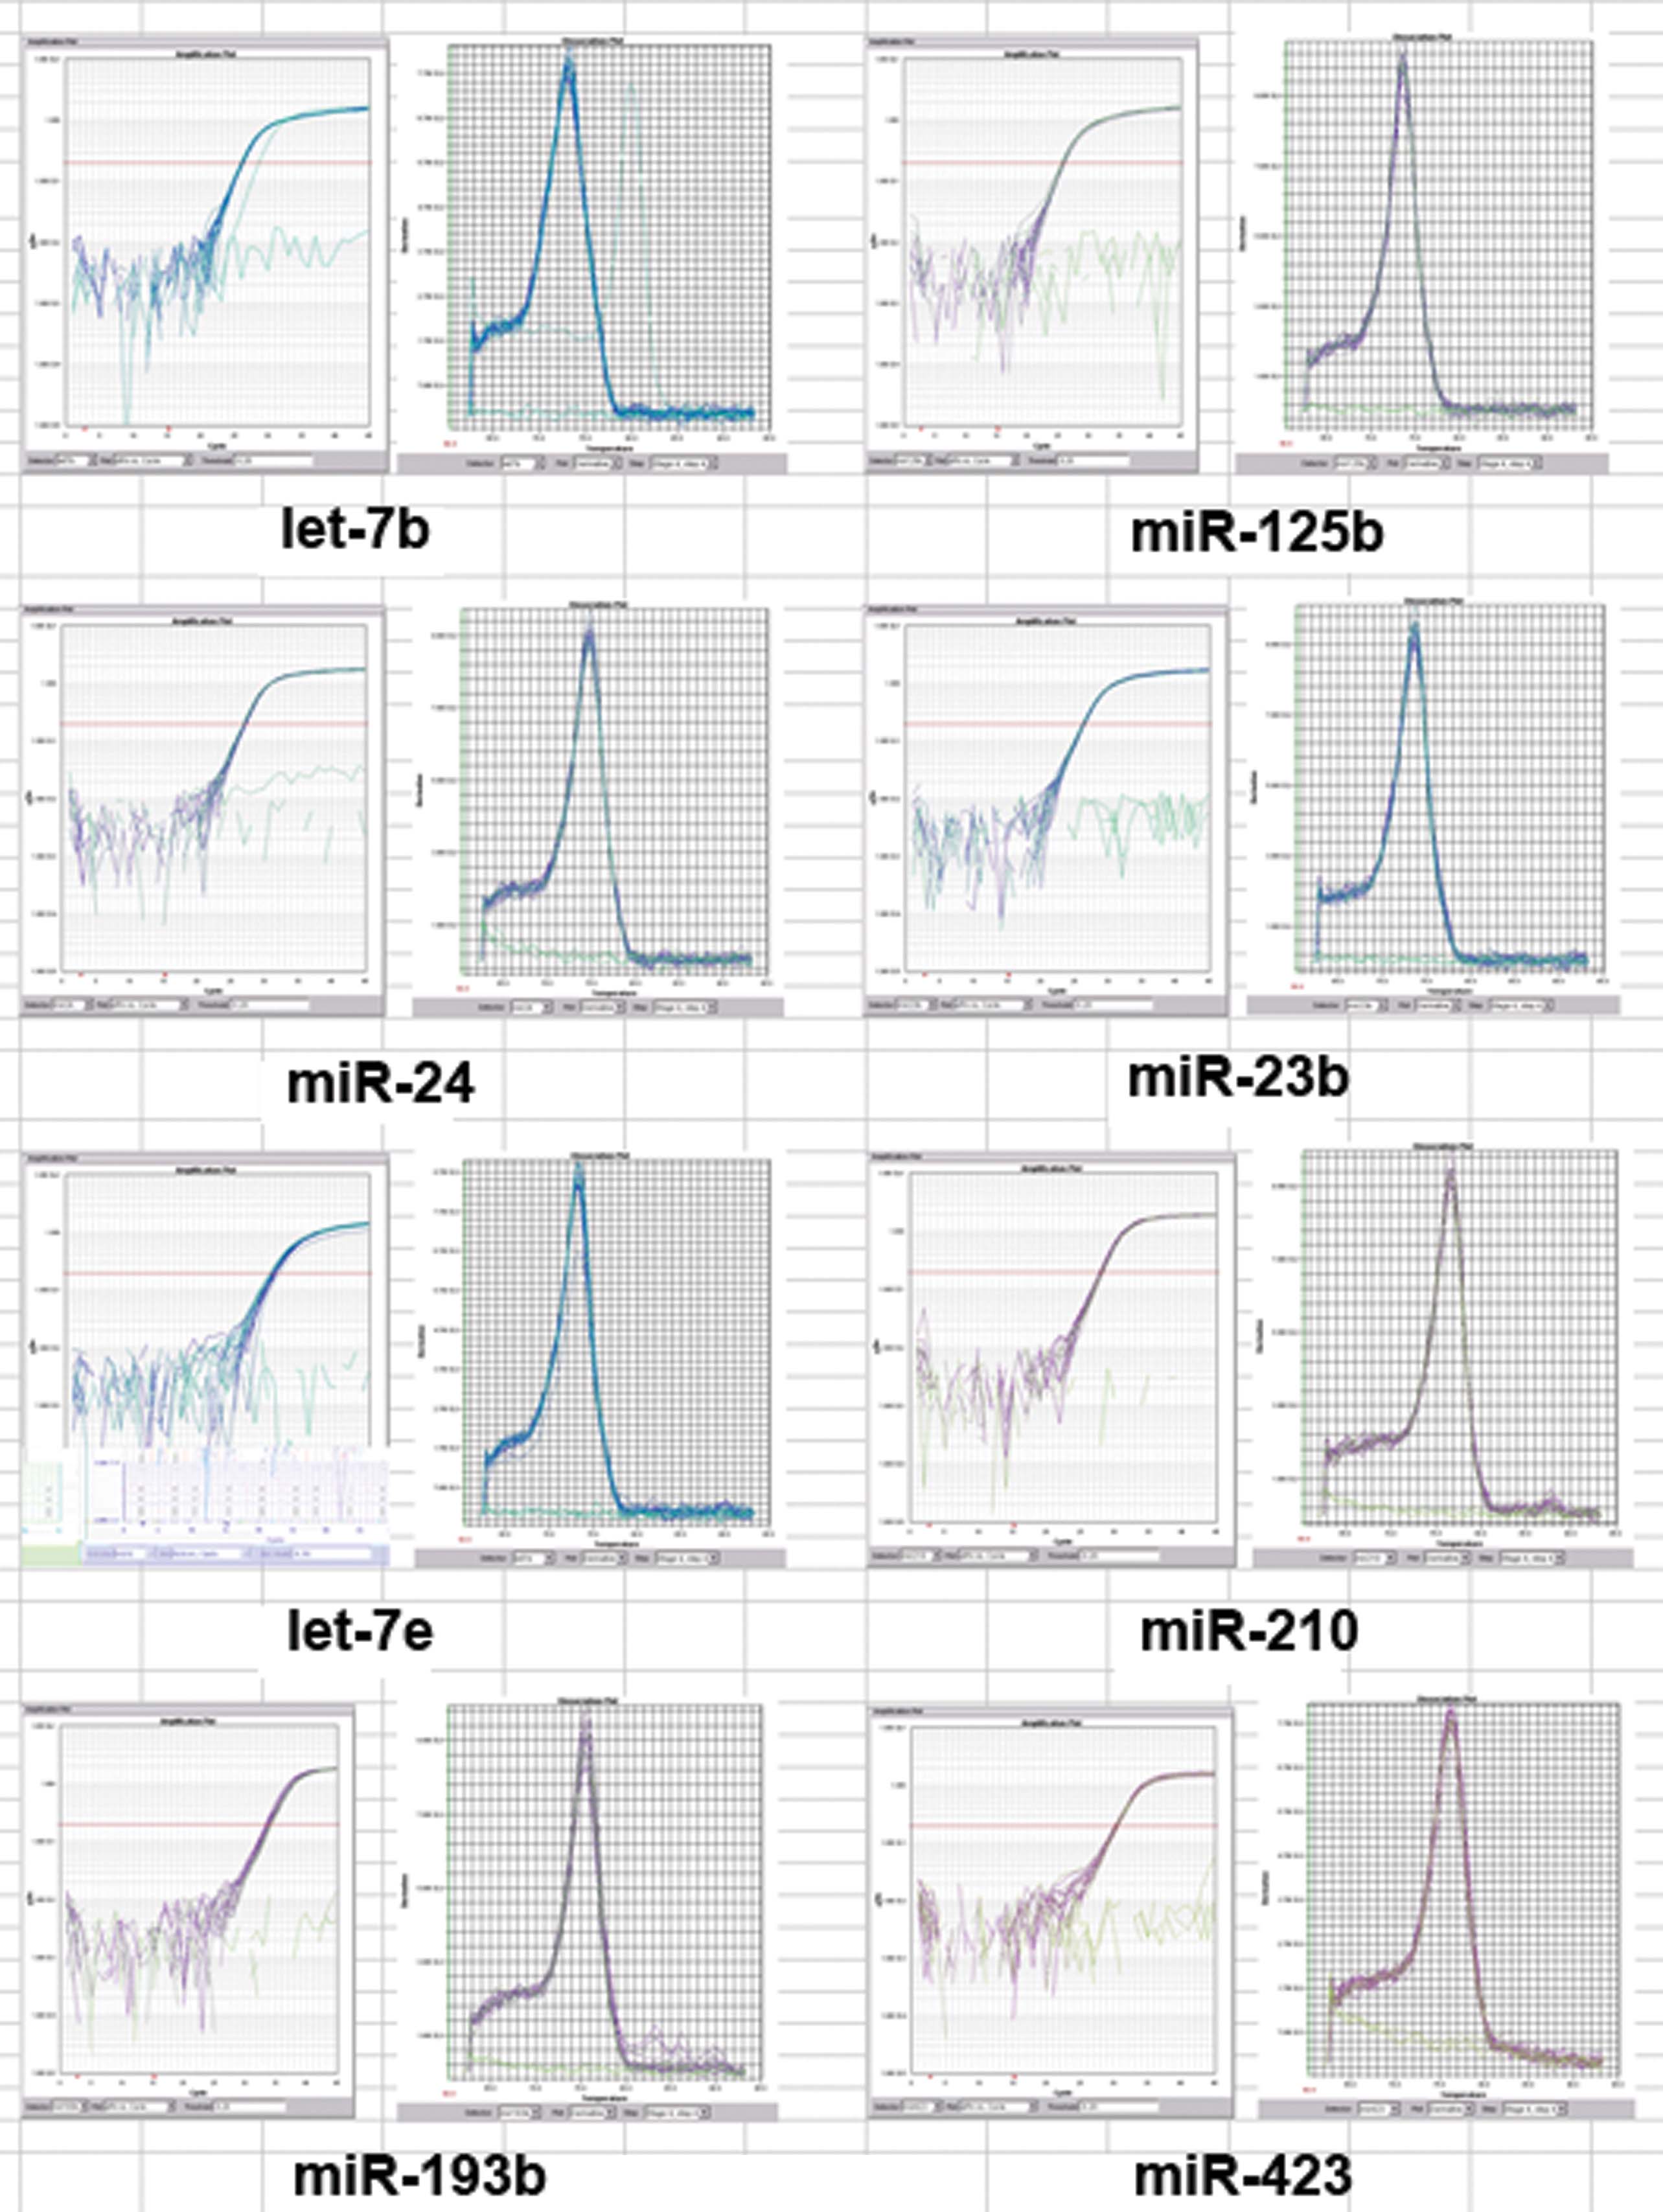
Figure 7.
Real-time RT–PCR validation of selected miRNAs. Amplification plot (left panel) and dissociation plot (right panel) for the indicated miRNA are shown.
 Figure 7 of Kutty, Mol Vis 2010; 16:1475-1486.