Figure 6. Microarray hybridization
analysis of miRNAs normally expressed in ARPE-19 cells. The data shown
is representative of hybridization analyses performed using two RNA
samples isolated from untreated ARPE-19 cells. The microarrays
contained duplicate spots for each miRNA probe. The average
fluorescence intensities are shown; the view is filtered by name, which
has multiple members selected.
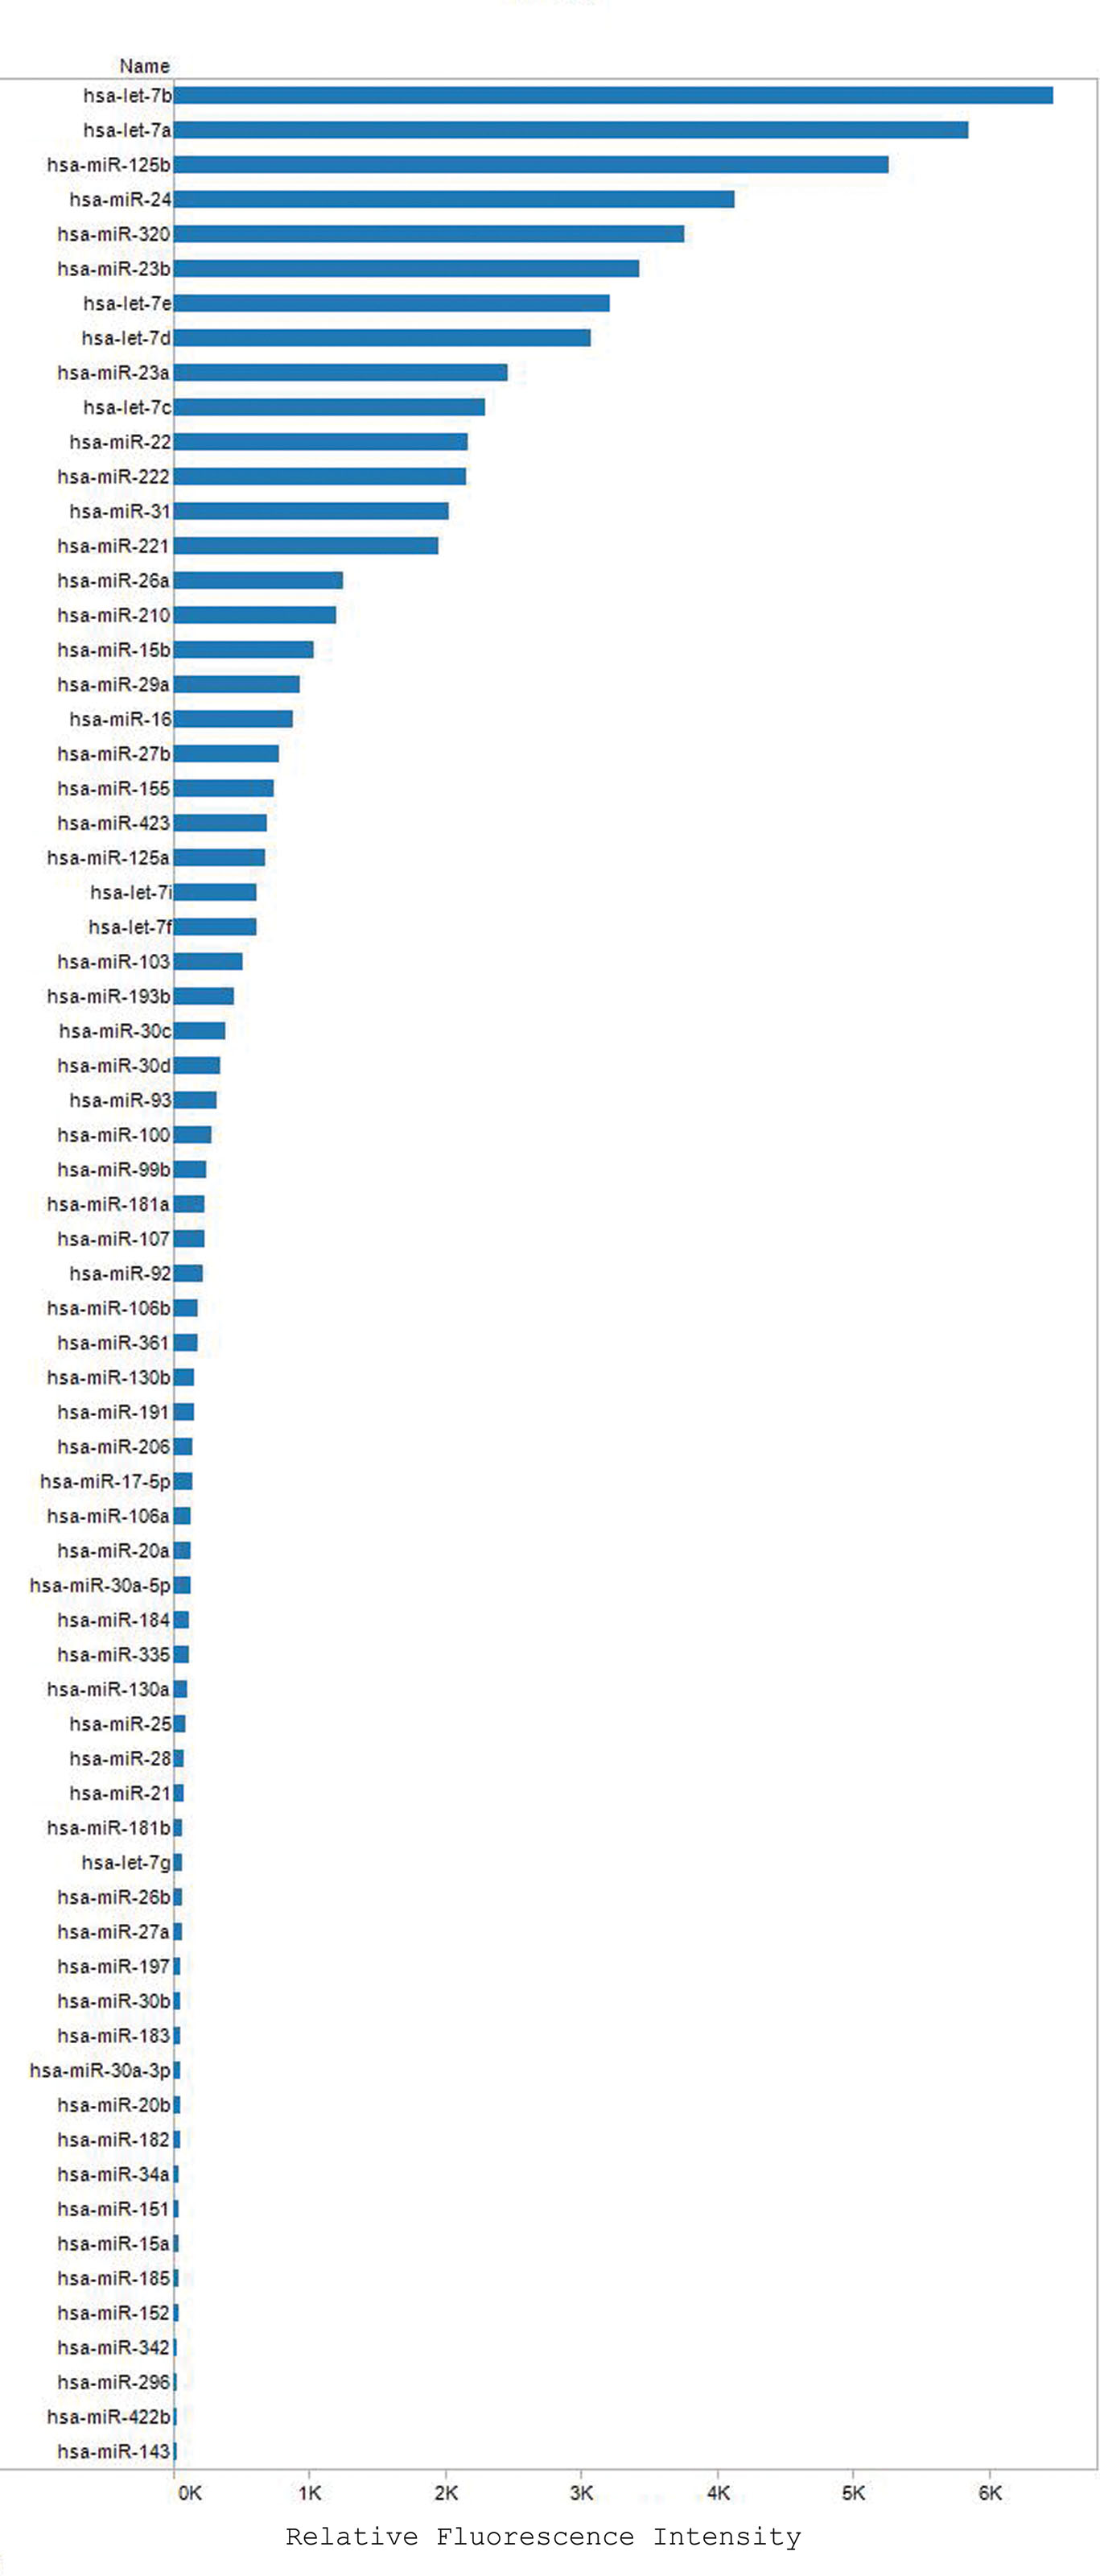
 Figure 6 of Kutty, Mol Vis 2010; 16:1475-1486.