Figure 7. LSCM images showing the F-actin distribution in RCS/Lav rat lenses. A, B, C: F-actin in posterior fiber segments approaching sutures at 2–3 weeks (A), 4–6 weeks (B) and 7–8 weeks (C) clearly outlined the lateral membranes at all ages. A few scattered foci of actin were seen (arrows); panel C clearly shows a forming suture sub-branch (double arrowhead). D: F-actin delineated the fiber ends at 2–3 weeks and discrete scattered foci were visualized (arrows). E, F: Low and high magnification images showing the distinct rearrangement of F-actin into ‘rosettes’ at the vertices by 4–6 weeks.
G: The dotted line depicts the border of the PSC plaque with fiber ends within the plaque (left of the border) showing the
F-actin foci while the ends outside the confines of the plaque do not show the F-actin rearrangement. H, I: Low and high magnification images showing the drastic change in shape of the fiber ends in a subset of severely affected
lenses. The ends were stellate shaped (panel I, asterisks) with surrounding areas of degeneration. Some fiber ends showed a fibrillar actin network present within them
(panel I, arrows).
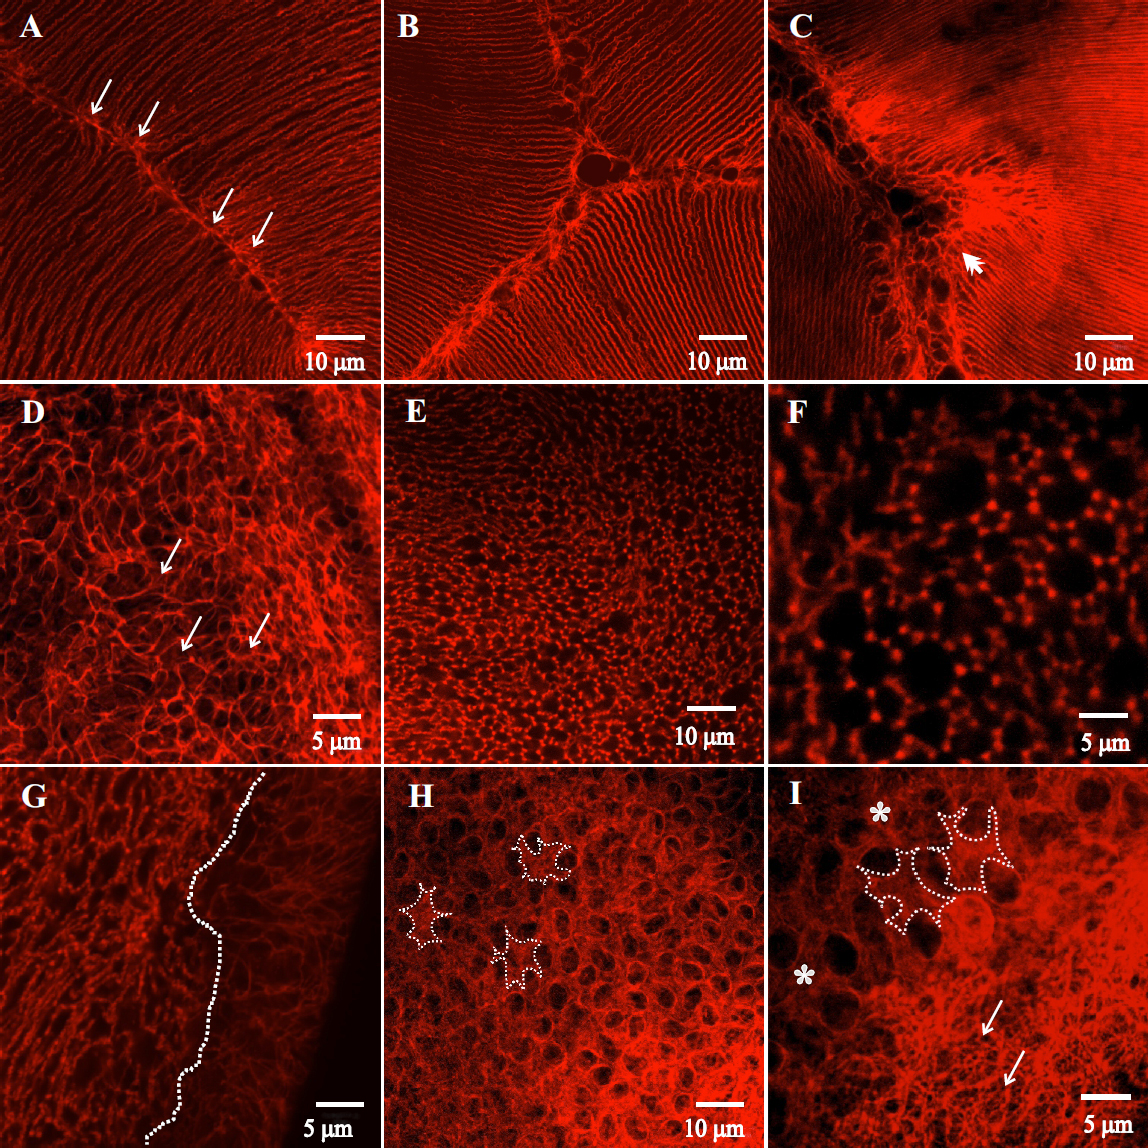
 Figure 7 of
Joy, Mol Vis 2010; 16:1453-1466.
Figure 7 of
Joy, Mol Vis 2010; 16:1453-1466.