Figure 6. Scanning electron micrographs and LSCM images of RCS-rdy+/Lav lenses (controls). A, B, C: SEM images of control lenses at 2–3, 4–6 and 7–8 weeks postnatal respectively showed a normal
size, shape and arrangement of posterior fiber ends. Filopodia can be seen extending uniformly in the direction of fiber end
migration. Panels B and C show fiber ends in the sutural domain with blue dotted lines indicating the position of suture branches.
The ends in this area exhibit round profiles and is consistent with the expected fiber end morphology within sutural domains.
D, E, F: Confocal images of control lenses at 2–3, 4–6 and 7–8 weeks postnatal showing the distribution of F-actin. As expected,
F-actin clearly outlines the fiber end profiles and lateral membranes at all age groups.
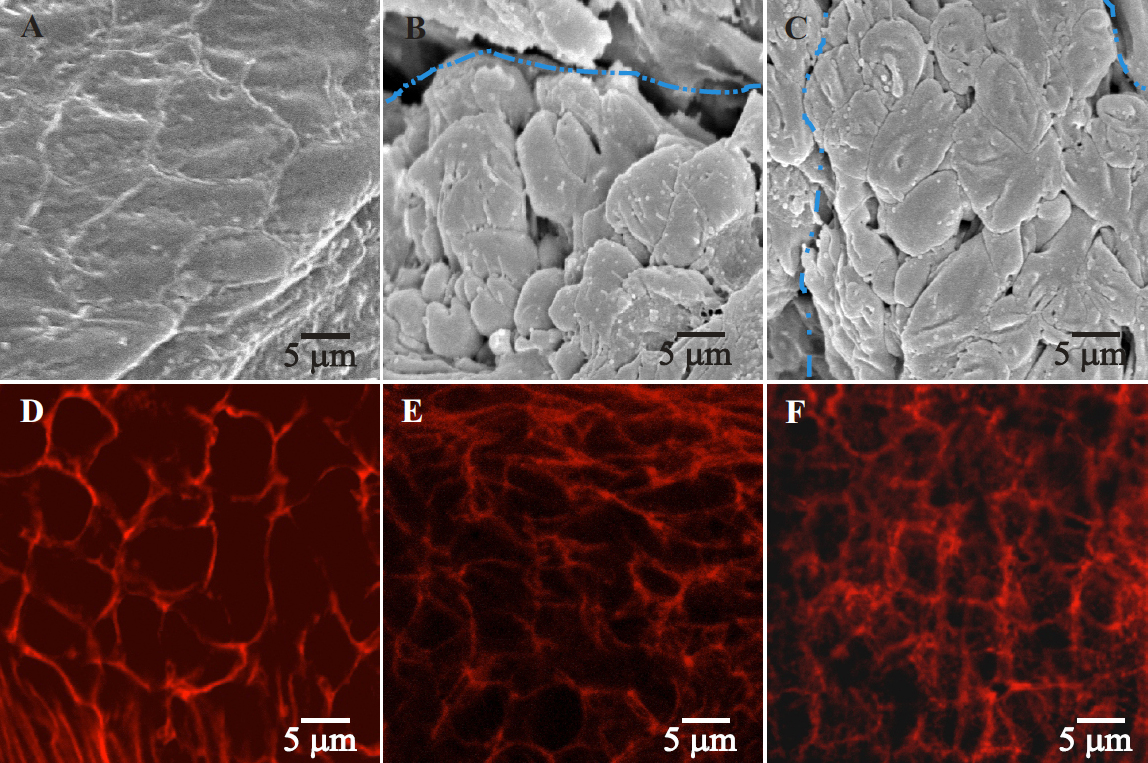
 Figure 6 of
Joy, Mol Vis 2010; 16:1453-1466.
Figure 6 of
Joy, Mol Vis 2010; 16:1453-1466.