Figure 1. Representative immnocytochemical preparations showing the expression of NGF-receptors in HCECs cultured in vitro for 4 days
under different conditions. TrkA expression in control condition (A), TrkA expression in cells exposed to NGF (B) and TrkA expression in cells exposed to ANA (C). Note that NGF enhances and ANA down-regulates the expression of TrkA. Panel D illustrate the expression of the NGF-receptor p75 in control conditions, in cells exposed to NGF (E), and in cells exposed to ANA (F). This NGF-receptor is nearly non-expressed in control HCECs (D), it is unaffected after treatment with NGF (E) or ANA (F). Scale bars: A-F 20 μm. Panels G and H report the results of western blot and real-time PCR of HCECs treated with NGF or ANA. As indicated in G and H, compared to control, HCECs exposed to NGF express more, while these exposed to ANA express less TrkA protein. The PCR analysis
also revealed that NGF enhances and ANA reduces the expression of TrkA gene expression (I). Panel L reports the amount of NGF and VEGF expressed by HCECs under cultured for 4 days without NGF. This result indicates that these
cells constitutively express, though differently, both NGF and VEGF. As illustrated in M, confocal immunohistochemical analysis revealed that HCECs express VEGF (red) and TrkA (green). Scale bar: M=8 μm.
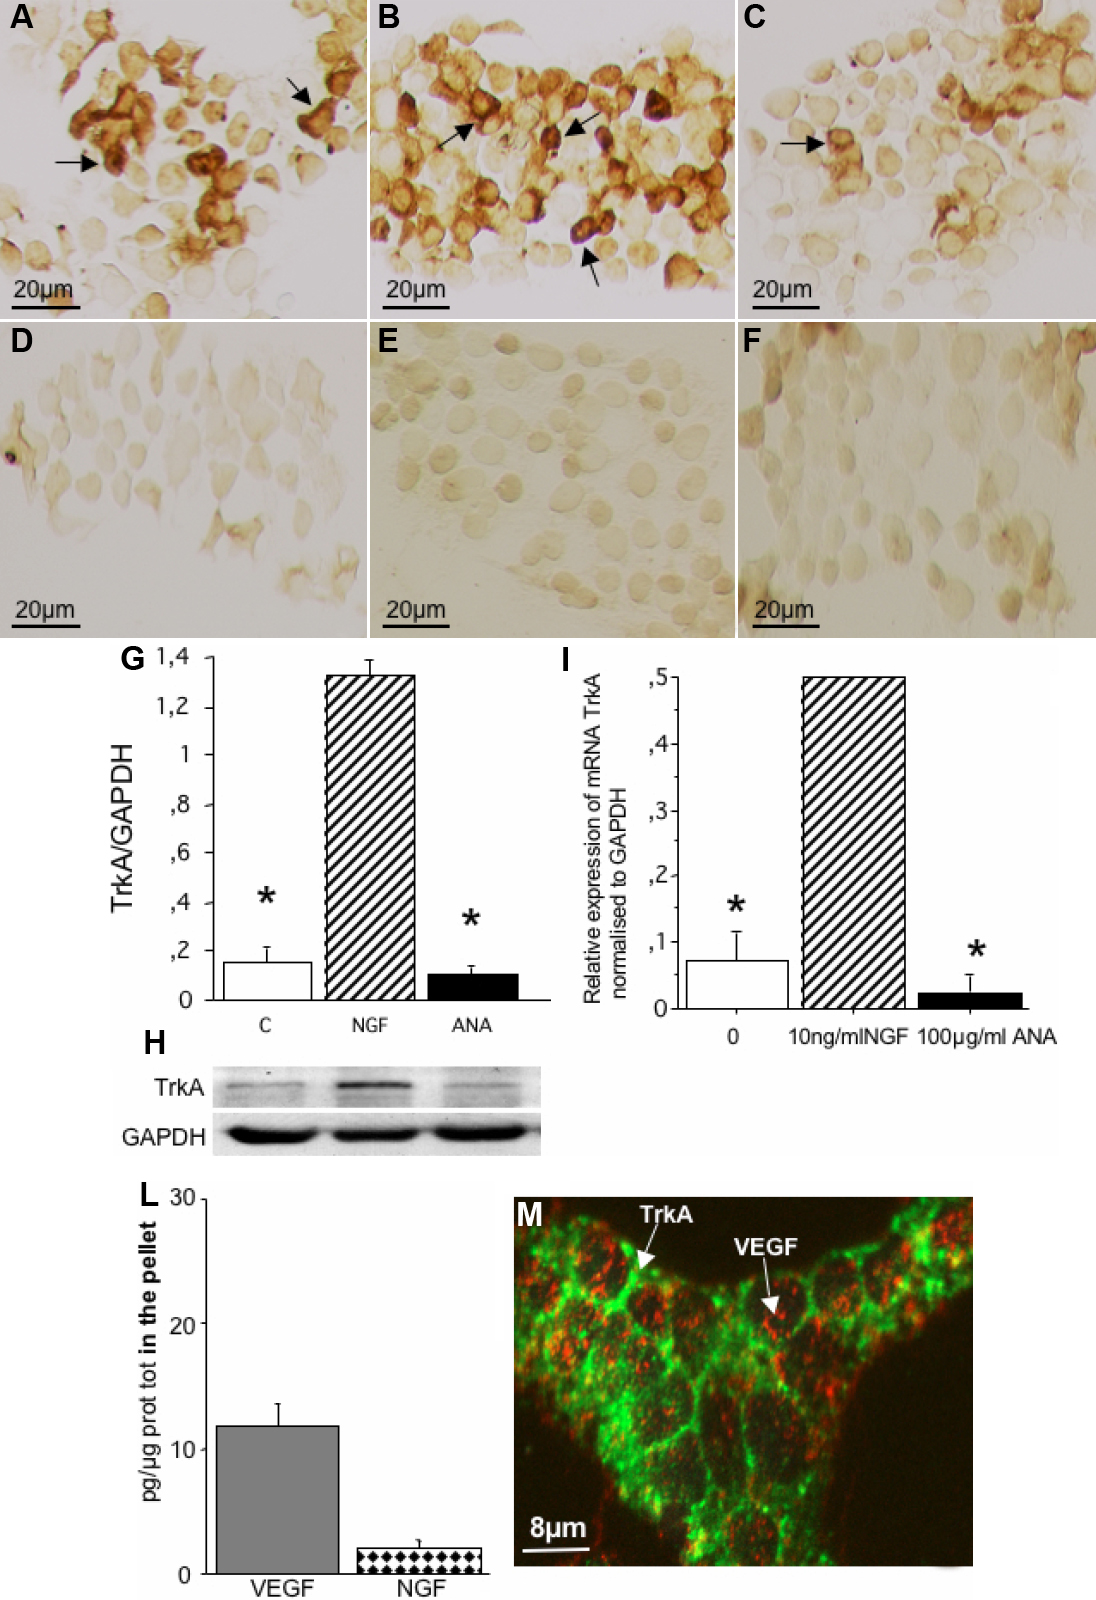
 Figure 1 of
Sornelli, Mol Vis 2010; 16:1439-1447.
Figure 1 of
Sornelli, Mol Vis 2010; 16:1439-1447.