Figure 6. Cellular ectopia into the
vitreous humor through the breached inner limiting membrane was
observed at all stages after embryonic day 13.5. Protein O-mannose
N-acetylglucosaminyltransferase 1 (POMGnT1) knockout retinas at E13.5 (A),
E17.5
(B), P0 (C), and P21 (D) were analyzed by
electron microscopy. Note the protrusion of radial glial processes
(dark square in A) and ectopia of retinal ganglion cells (dark
circles in B–D). Asterisks indicate the location of the
inner limiting membrane. Abbreviations: E represents embryonic day; P
represents postnatal day. The scale bars in A–C are
equal to 500 nm. The scale bar in D is equal to 2 μm.
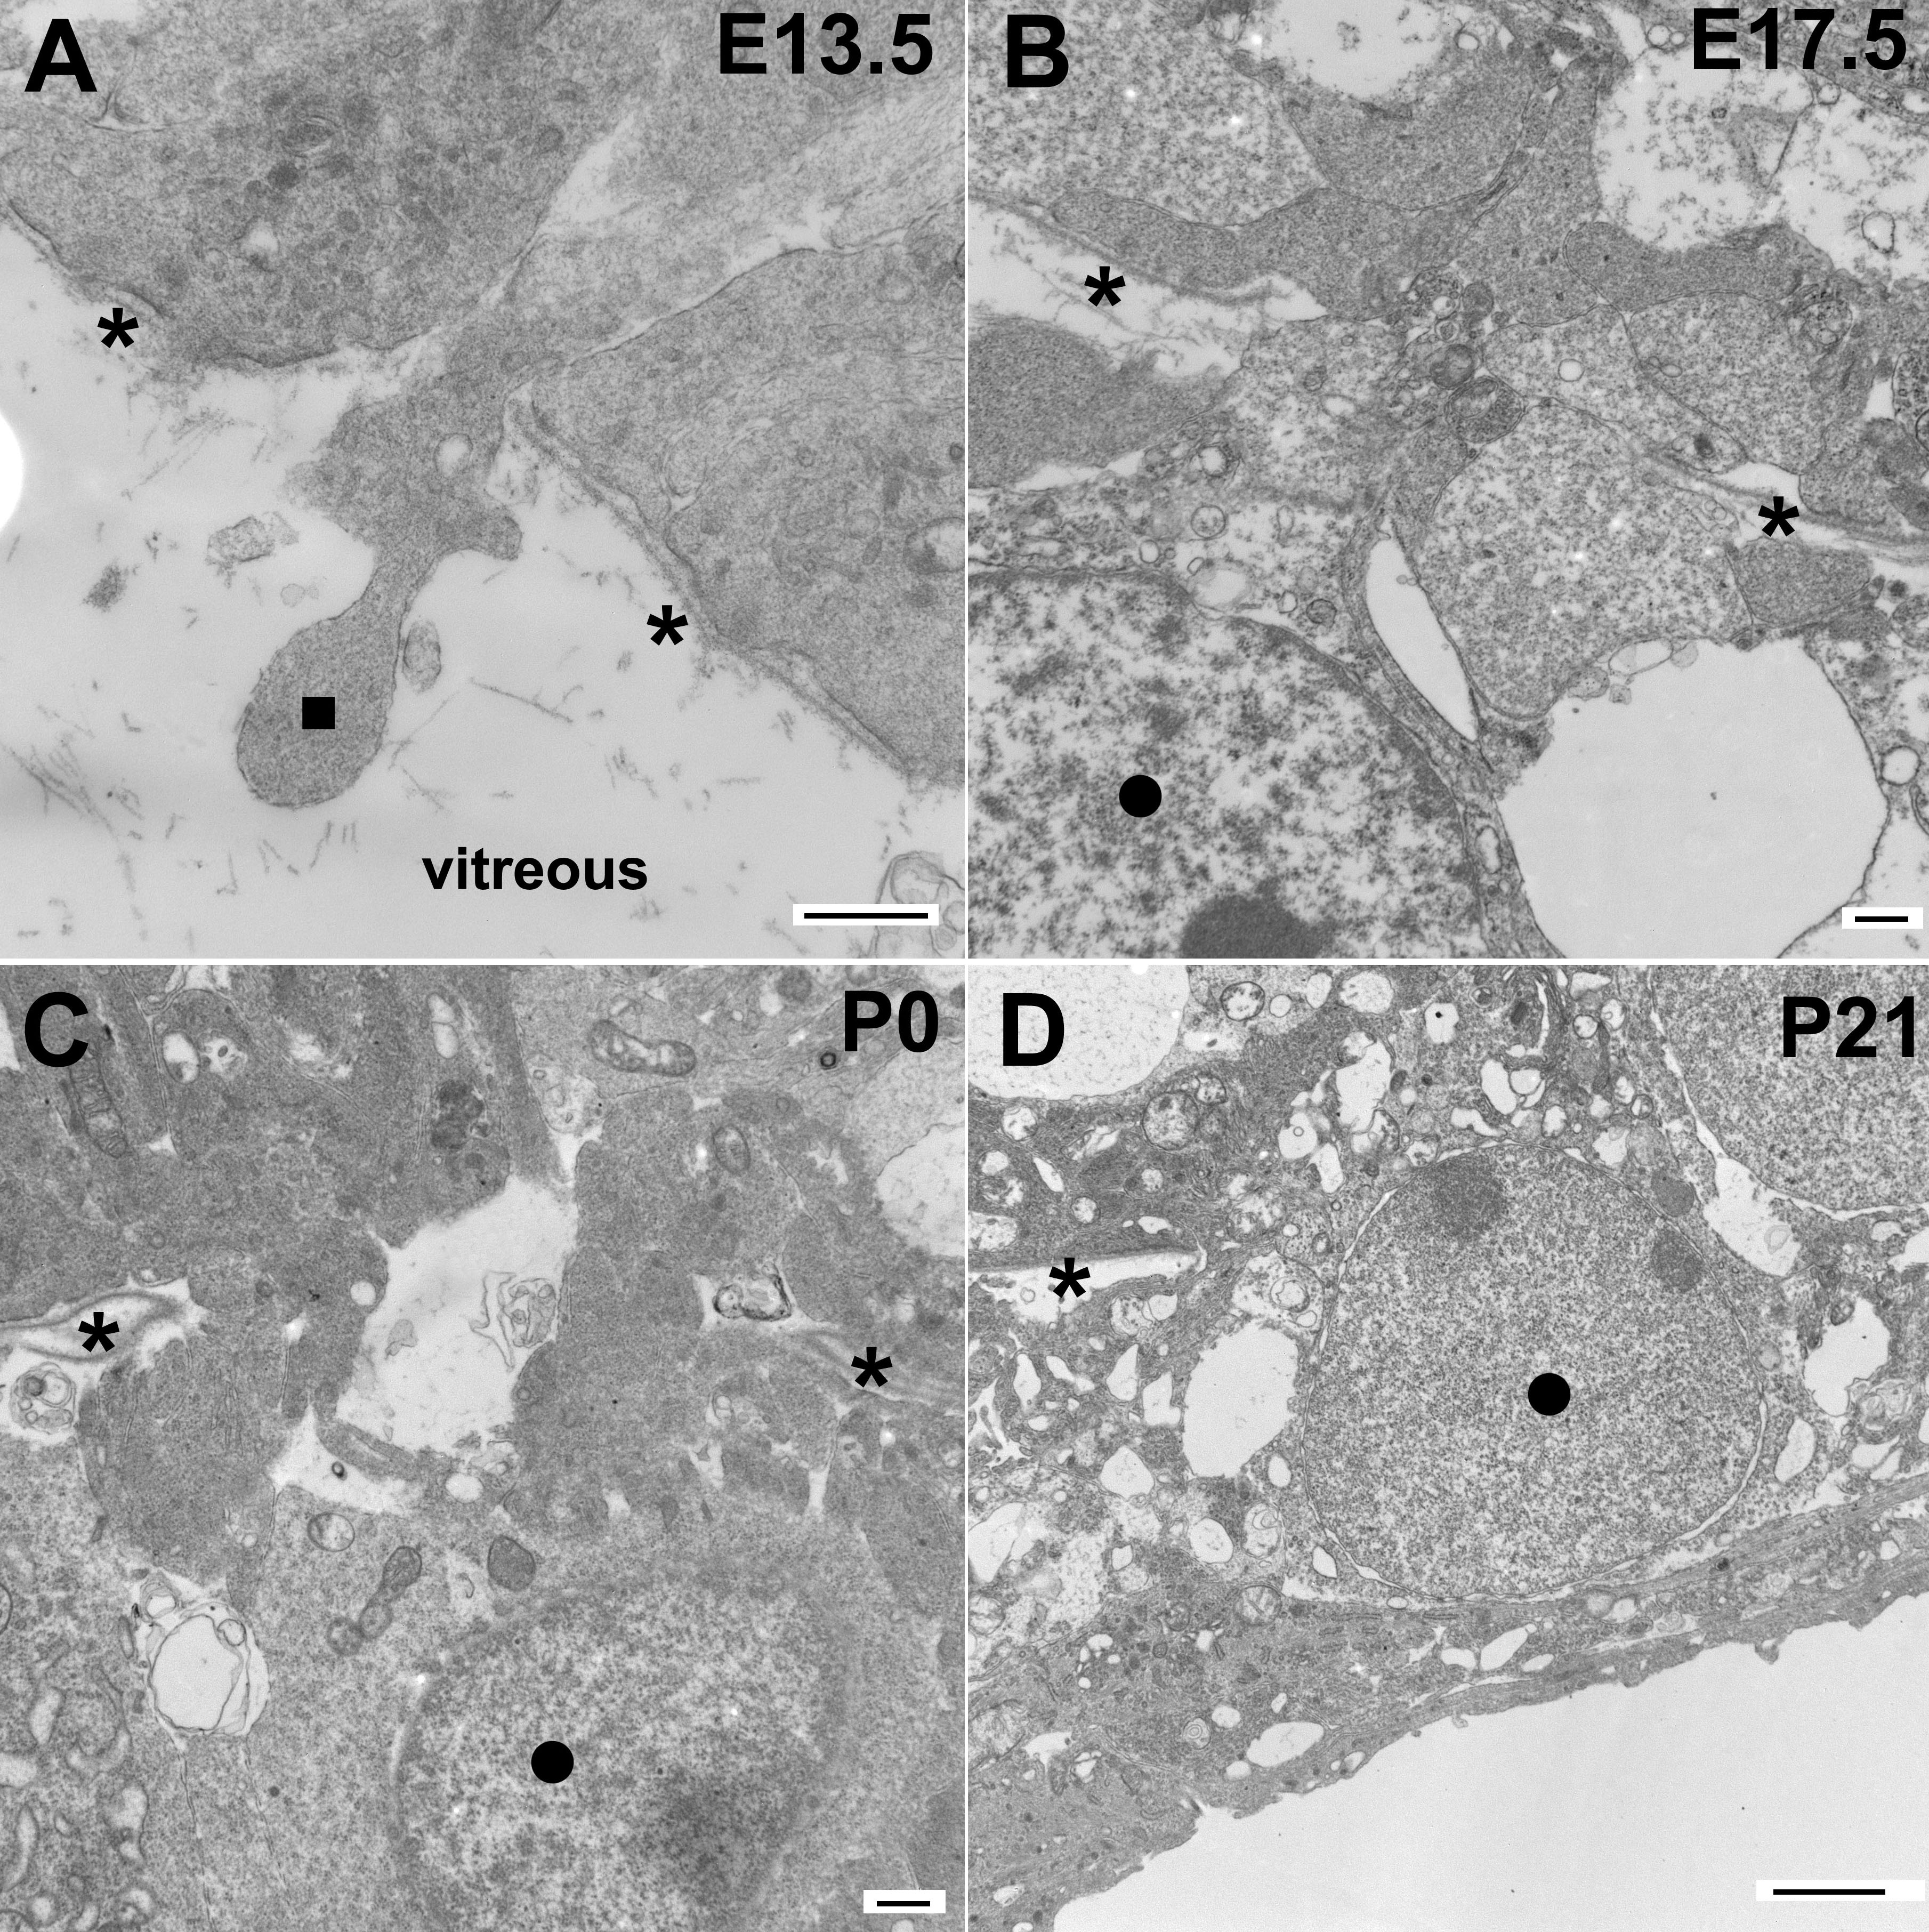
 Figure 6 of Hu, Mol Vis 2010; 16:1415-1428.