Figure 3. Protein O-mannose
N-acetylglucosaminyltransferase 1 knockout retinas exhibit ectopia of
retinal ganglion cells. Transmission and scanning electron microscopy
was performed for the adult retina. Transmission electromicroscopic
micrographs (A, B) and scanning electron microscopic
micrographs (C, D) are shown. (A, C) show
the wild type retinas. (B, D) show the knockout retinas.
Note the presence of ectopic retinal ganglion cells (dark circles) and
inner plexiform layer components (dark square). Asterisks indicate the
location of the inner limiting membrane. The scale bar in A is
equal to 2 μm. The scale bar in B is equal to 10 μm. The scale
bar in D is equal to 10 μm for C and D. +/+
represents wild type; −/− represents homozygous knockout.
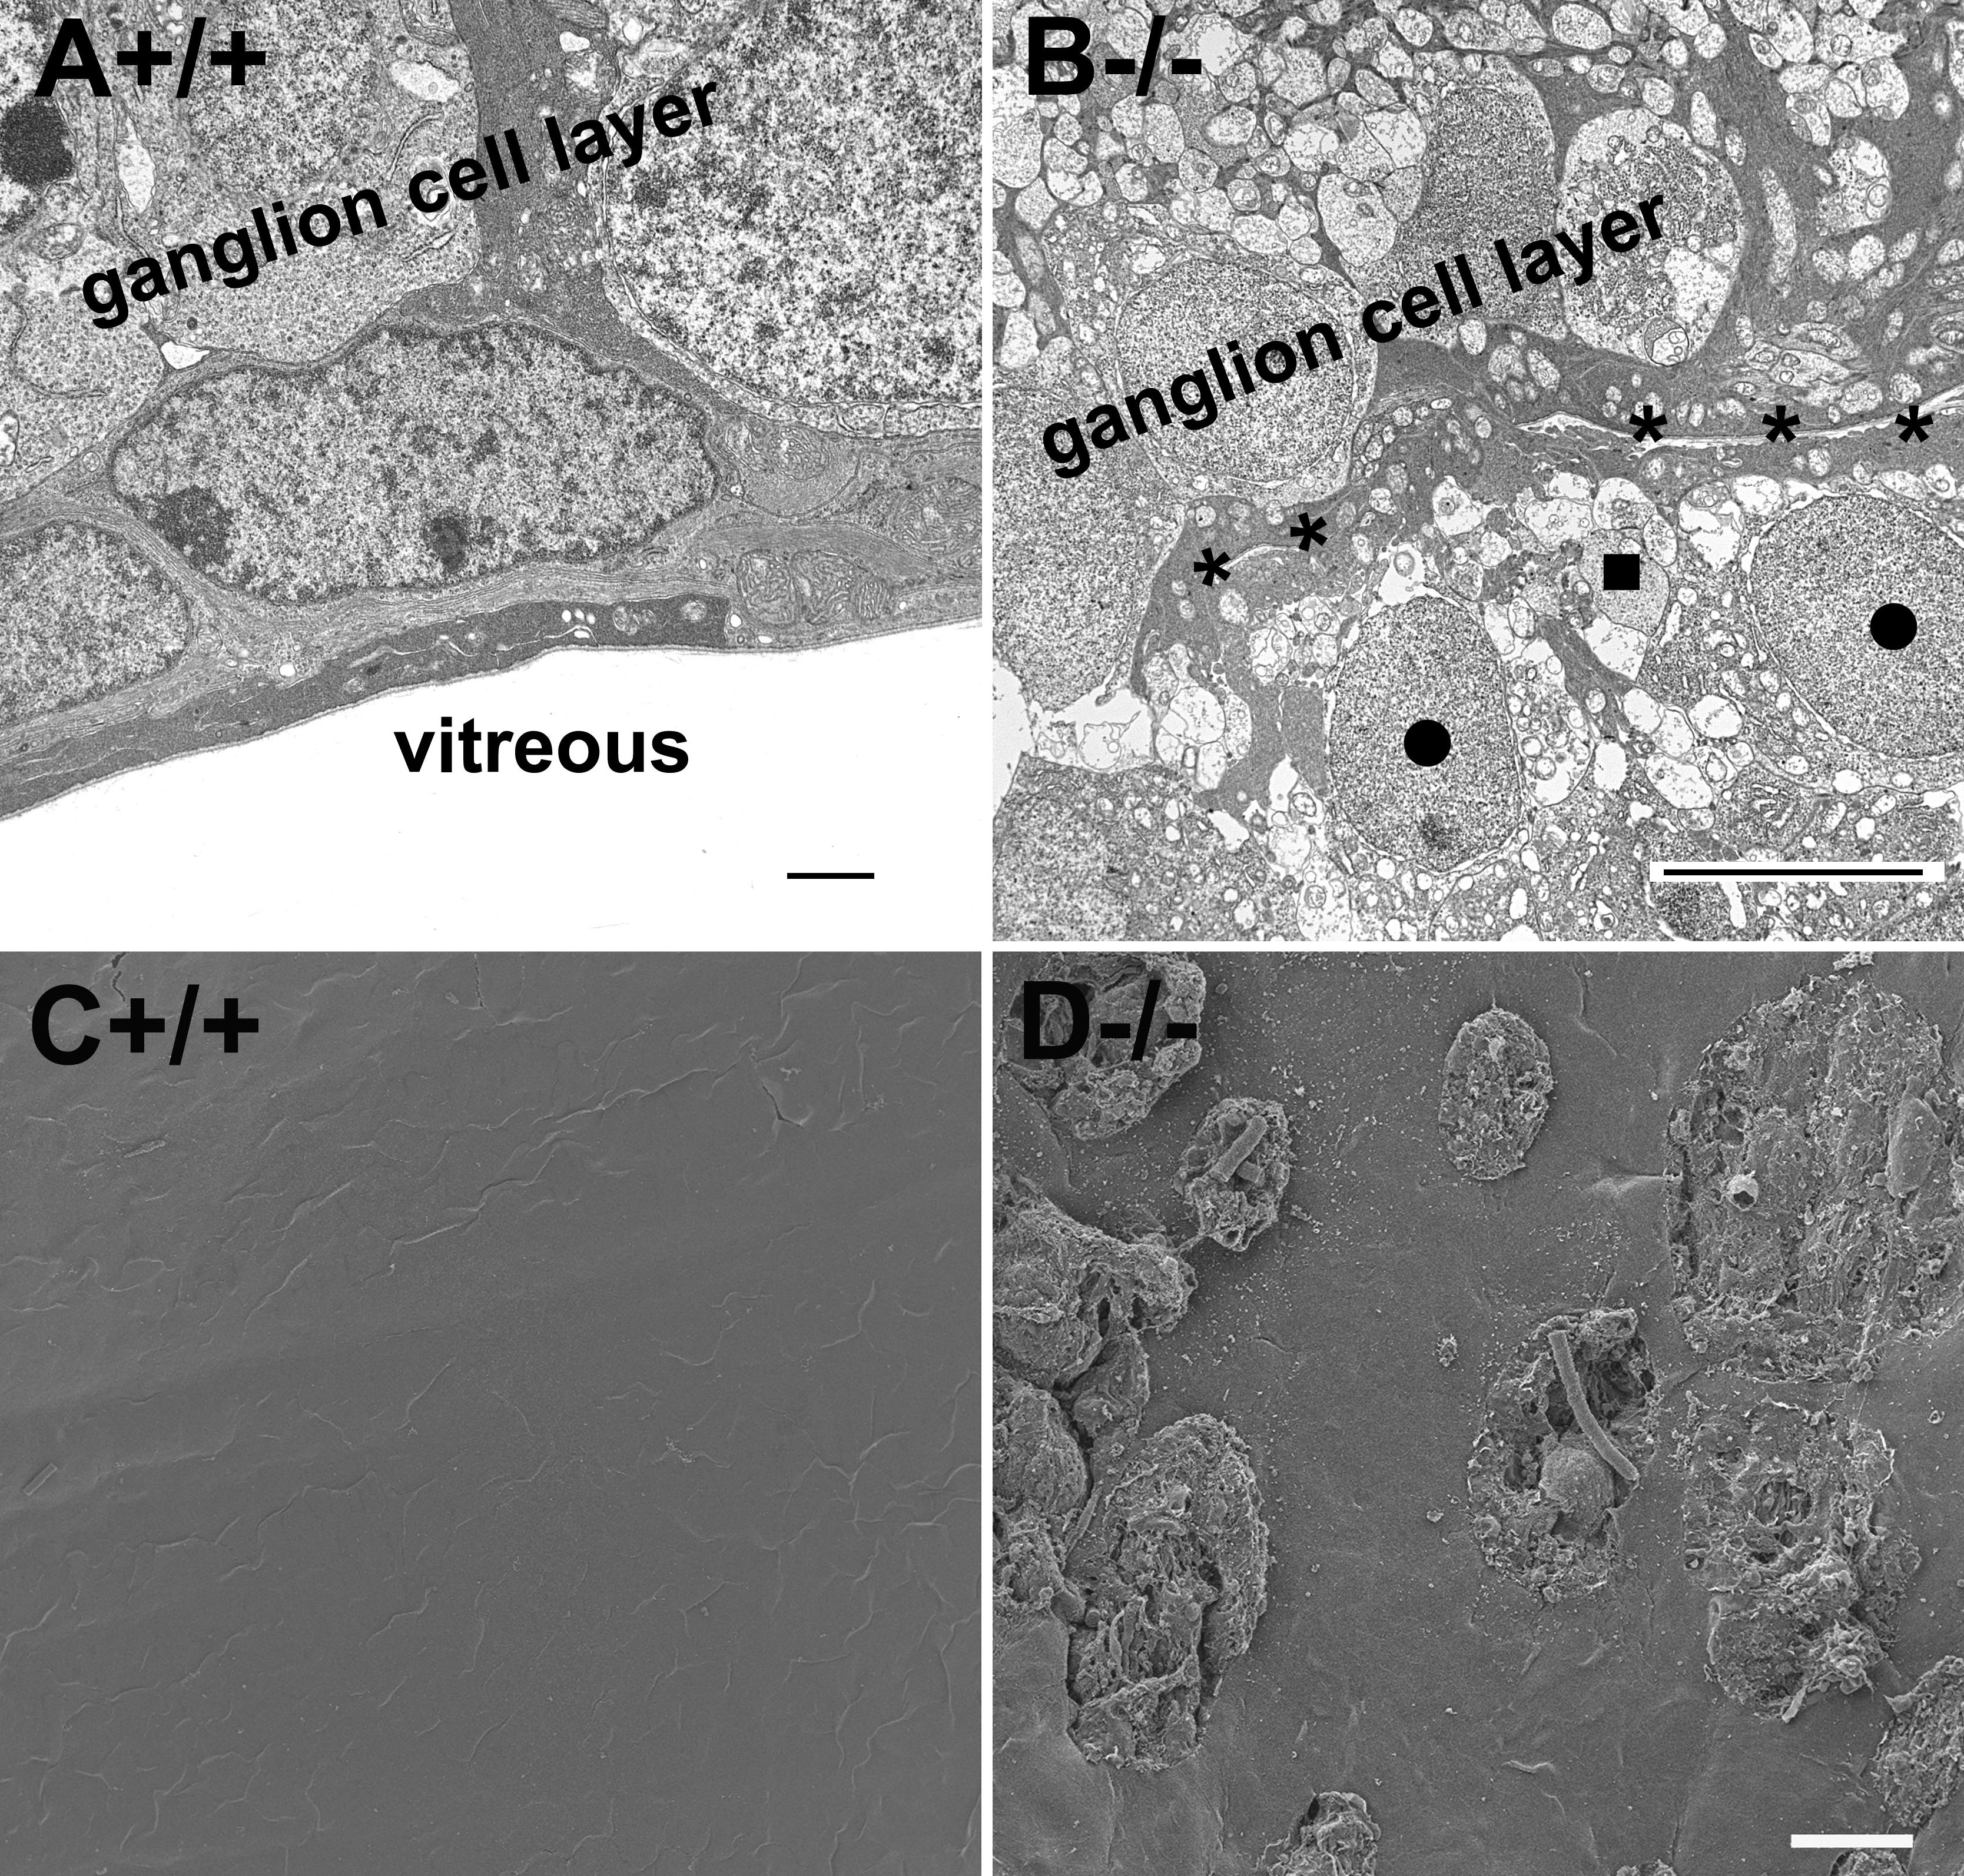
 Figure 3 of Hu, Mol Vis 2010; 16:1415-1428.