Figure 8. Analysis of LC3 expression
levels. A: western blotting analysis for evaluating the effects
of p62 or hsp70 RNA interference on LC3 levels in
ARPE-19 cells treated with 5 µM MG-132 and 50 nM bafilomycin. Lane 1.
control medium for 36 h; lane 2. MG-132 for 24 h + recover 6 h; lane 3.
control medium for 24 h + bafilomycin for 6 h; lane 4. MG-132 +
nonsilencing RNA for 24 h + recover 6 h; lane 5. MG-132 + p62
siRNA for 24 h + recover 6 h; lane 6. MG-132 + hsp70 siRNA for
24 h + recover 6 h; lane 7. MG-132 + nonsilencing RNA for 24 h +
recover in bafilomycin for 6 h; lane 8. MG-132 + p62 siRNA for
24 h + recover in bafilomycin for 6 h; lane 9. MG-132 + hsp70
siRNA for 24 h + recover in bafilomycin for 6 h; lane 10. control
medium for 48 h; lane 11. MG-132 for 24 h + recover 24 h; lane 12.
control medium for 24 h + bafilomycin for 24 h; lane 13. MG-132 +
nonsilencing RNA for 24 h + recover 24 h; lane 14. MG-132 + p62
siRNA for 24 h + recover 24 h; lane 15. MG-132 + hsp70 siRNA
for 24 h + recover 24 h; lane 16. MG-132 + nonsilencing RNA for 24 h +
recover in bafilomycin for 24 h; lane 17. MG-132 + p62 siRNA
for 24 h + recover in bafilomycin for 24 h; lane 18. MG-132 + hsp70
siRNA for 24 h + recover in bafilomycin for 24 h. α-tubulin staining
was used to ensure equal loading of proteins. B: The ratio of a
lipidated LC3-II to a nonlipidated LC3-I. Experiments were repeated two
independent times.
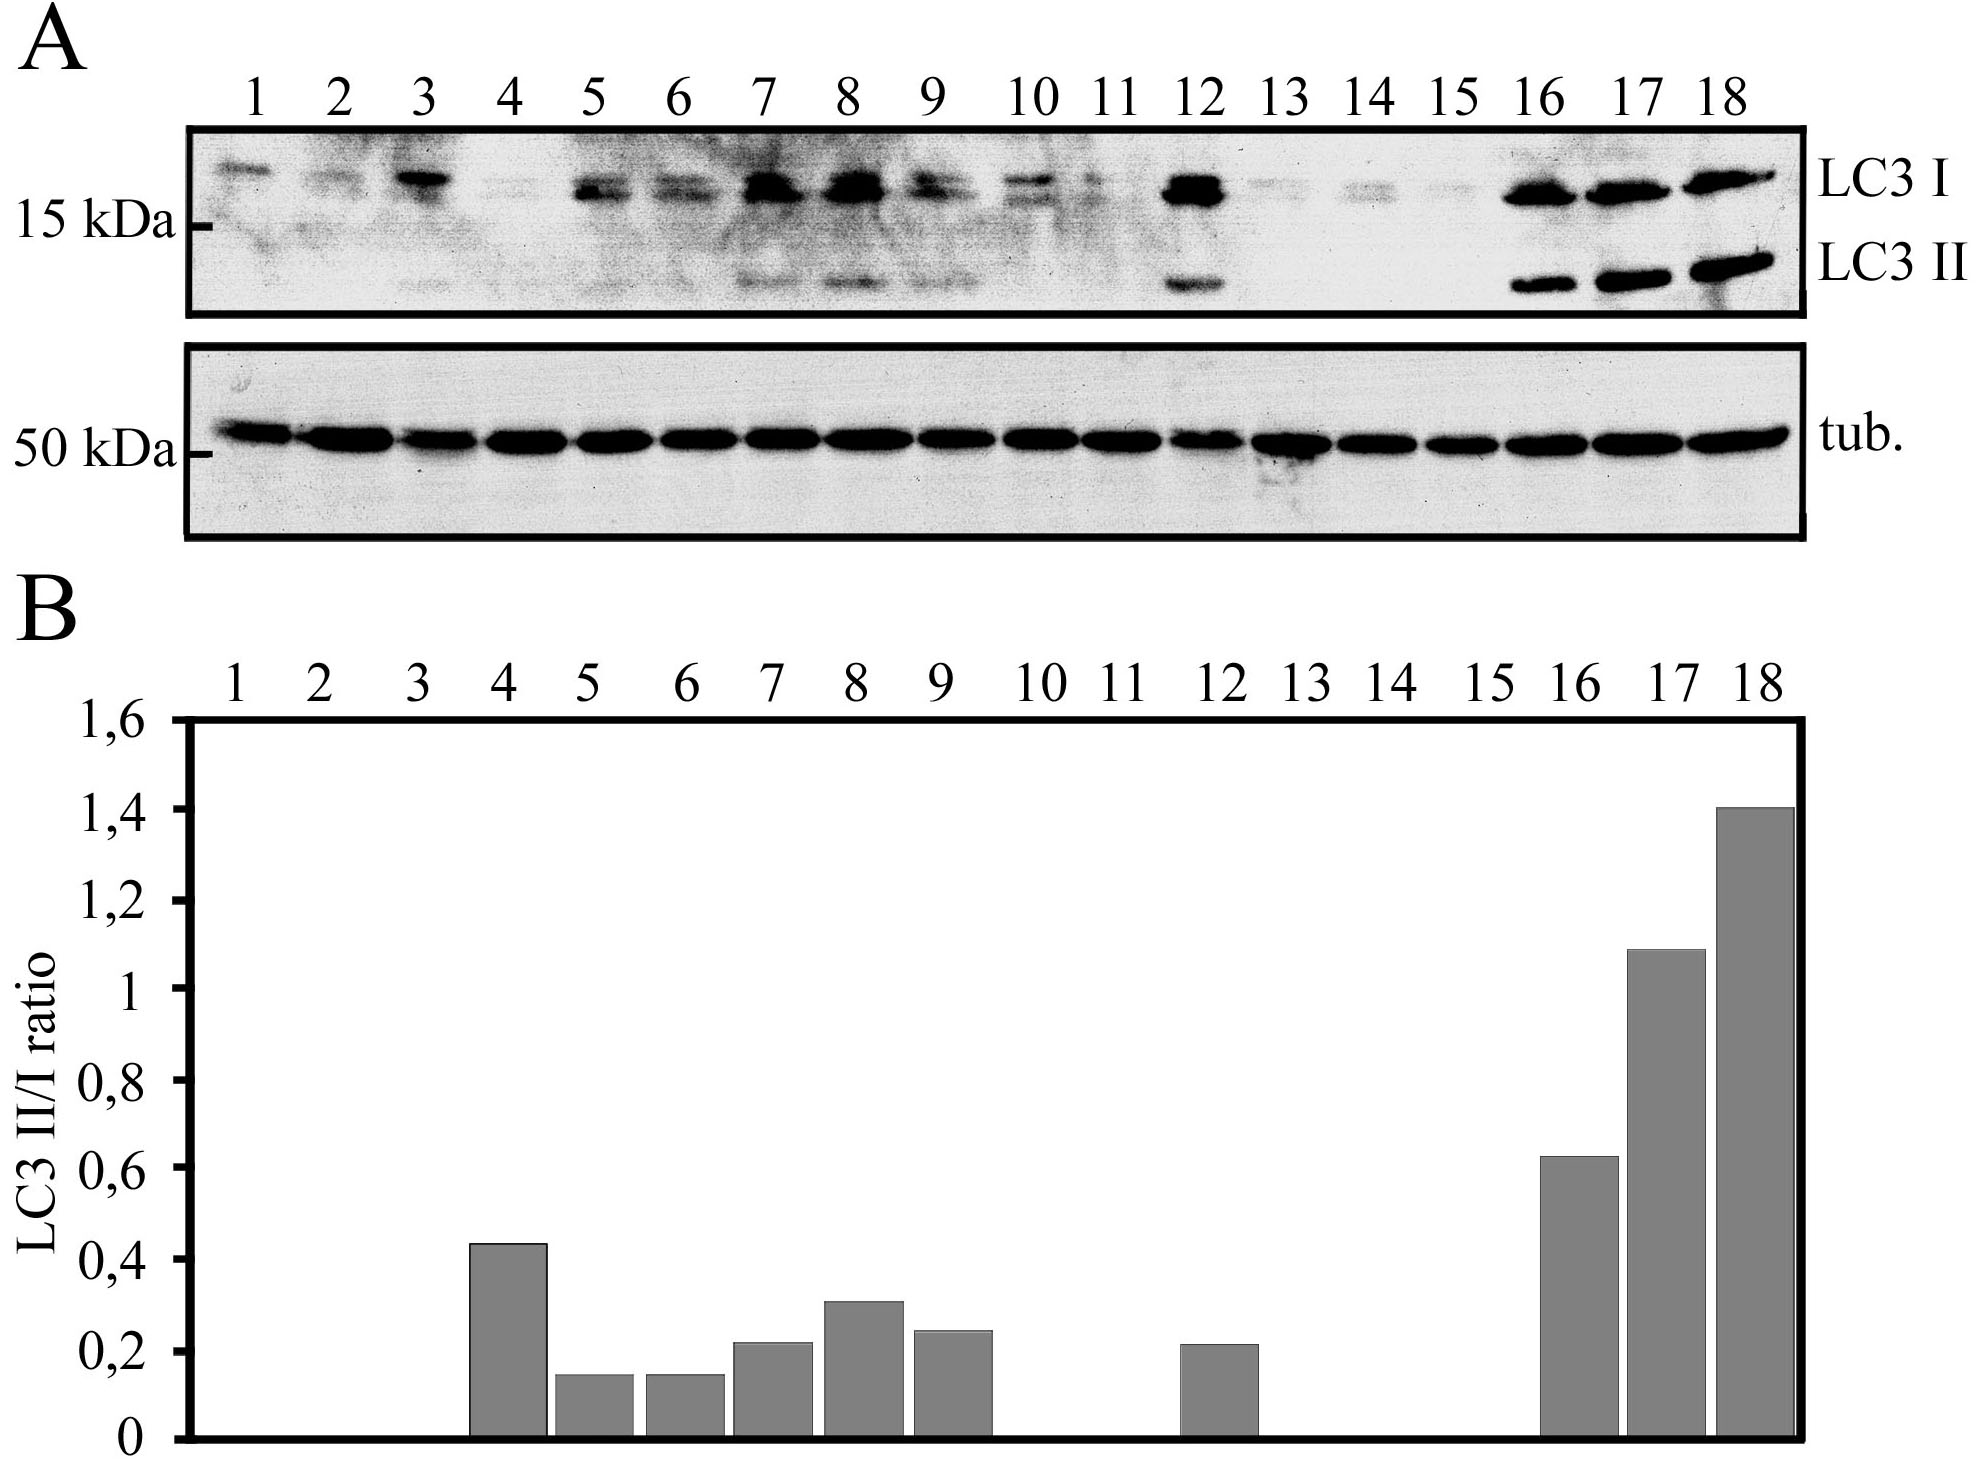
 Figure 8 of Viiri, Mol Vis 2010; 16:1399-1414.