Figure 5. Analysis of perinuclear
aggregates. A: Transmission electron micrographs of control
ARPE-19 cells (blank), cells exposed to transfection reagent, and cells
exposed to 5 µM MG-132 for 24 h with or without transfection reagent,
nonsilencing siRNA, hsp70 siRNA, or p62 siRNA (all 30
nM). The scale bar equal to 2 μm. B: Transmission electron
micrographs of the cells simultaneously treated with 5 µM MG-132 and
the transfection reagent, nonsilencing RNA, hsp70 siRNA, or p62
siRNA for 24 h, and then allowed to recover in normal cell culture
medium for 24 or 48 h. Arrows indicate autophagosomal structures.
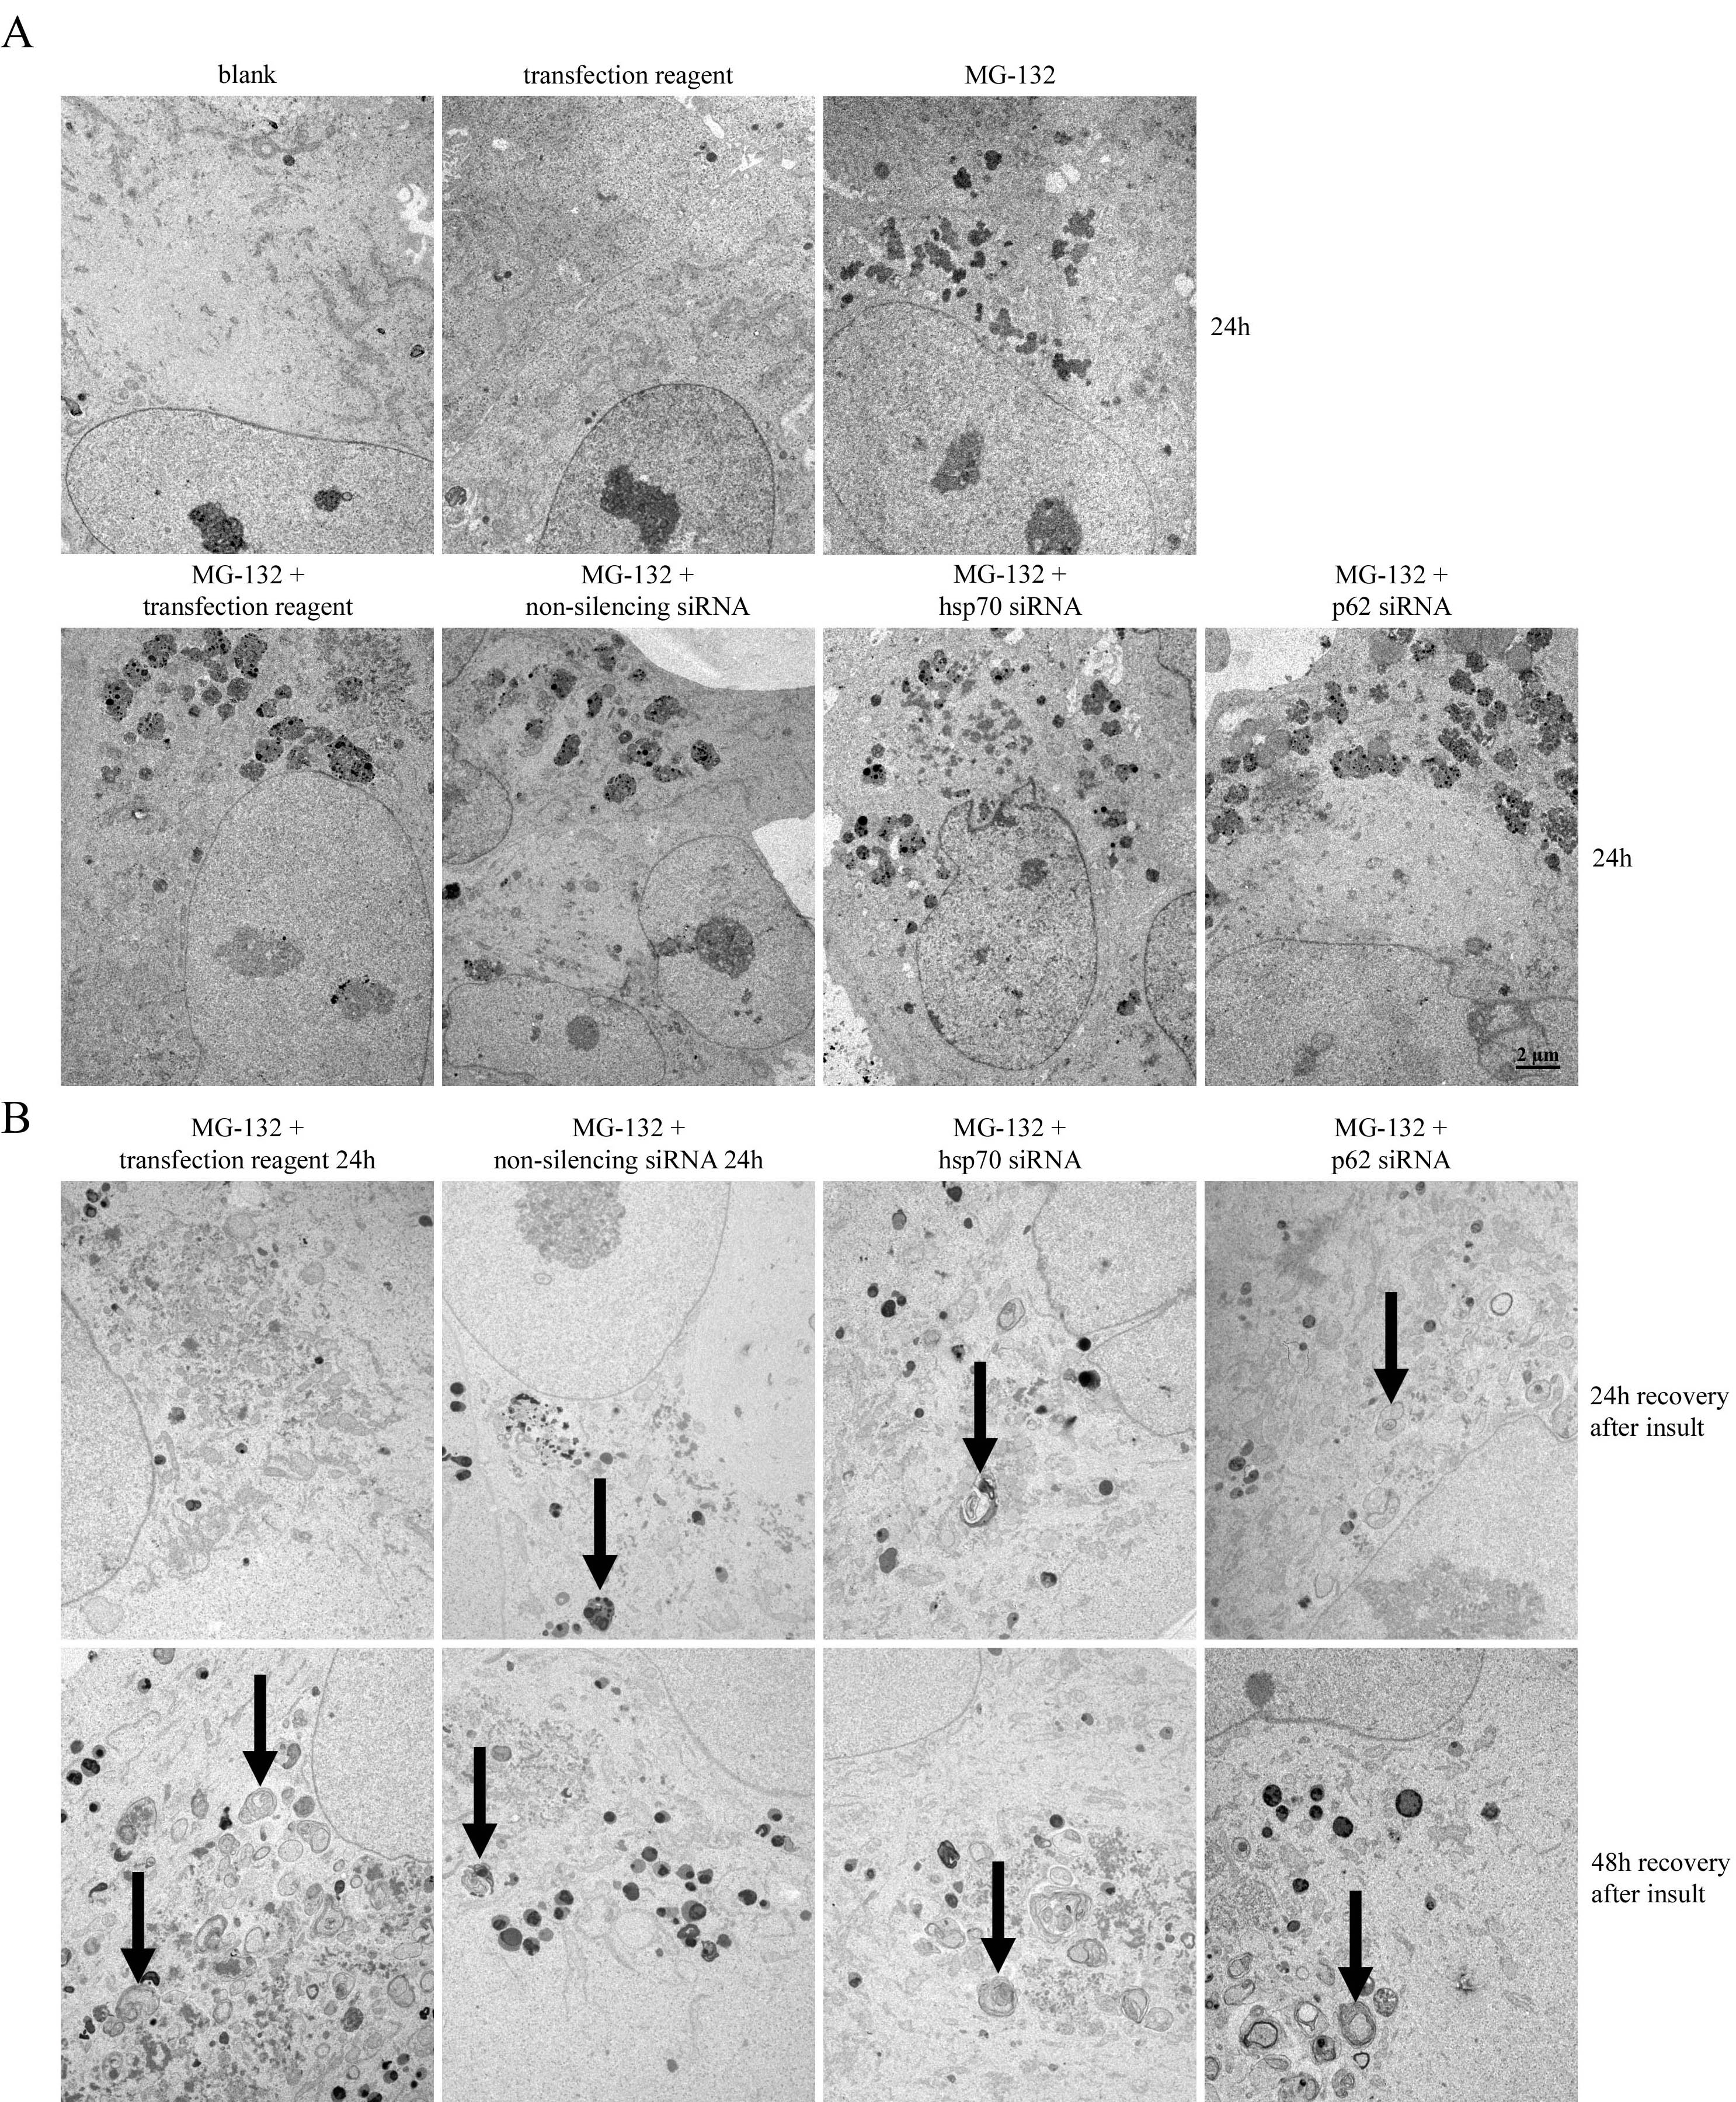
 Figure 5 of Viiri, Mol Vis 2010; 16:1399-1414.