Figure 2 of
Viiri, Mol Vis 2010; 16:1399-1414.
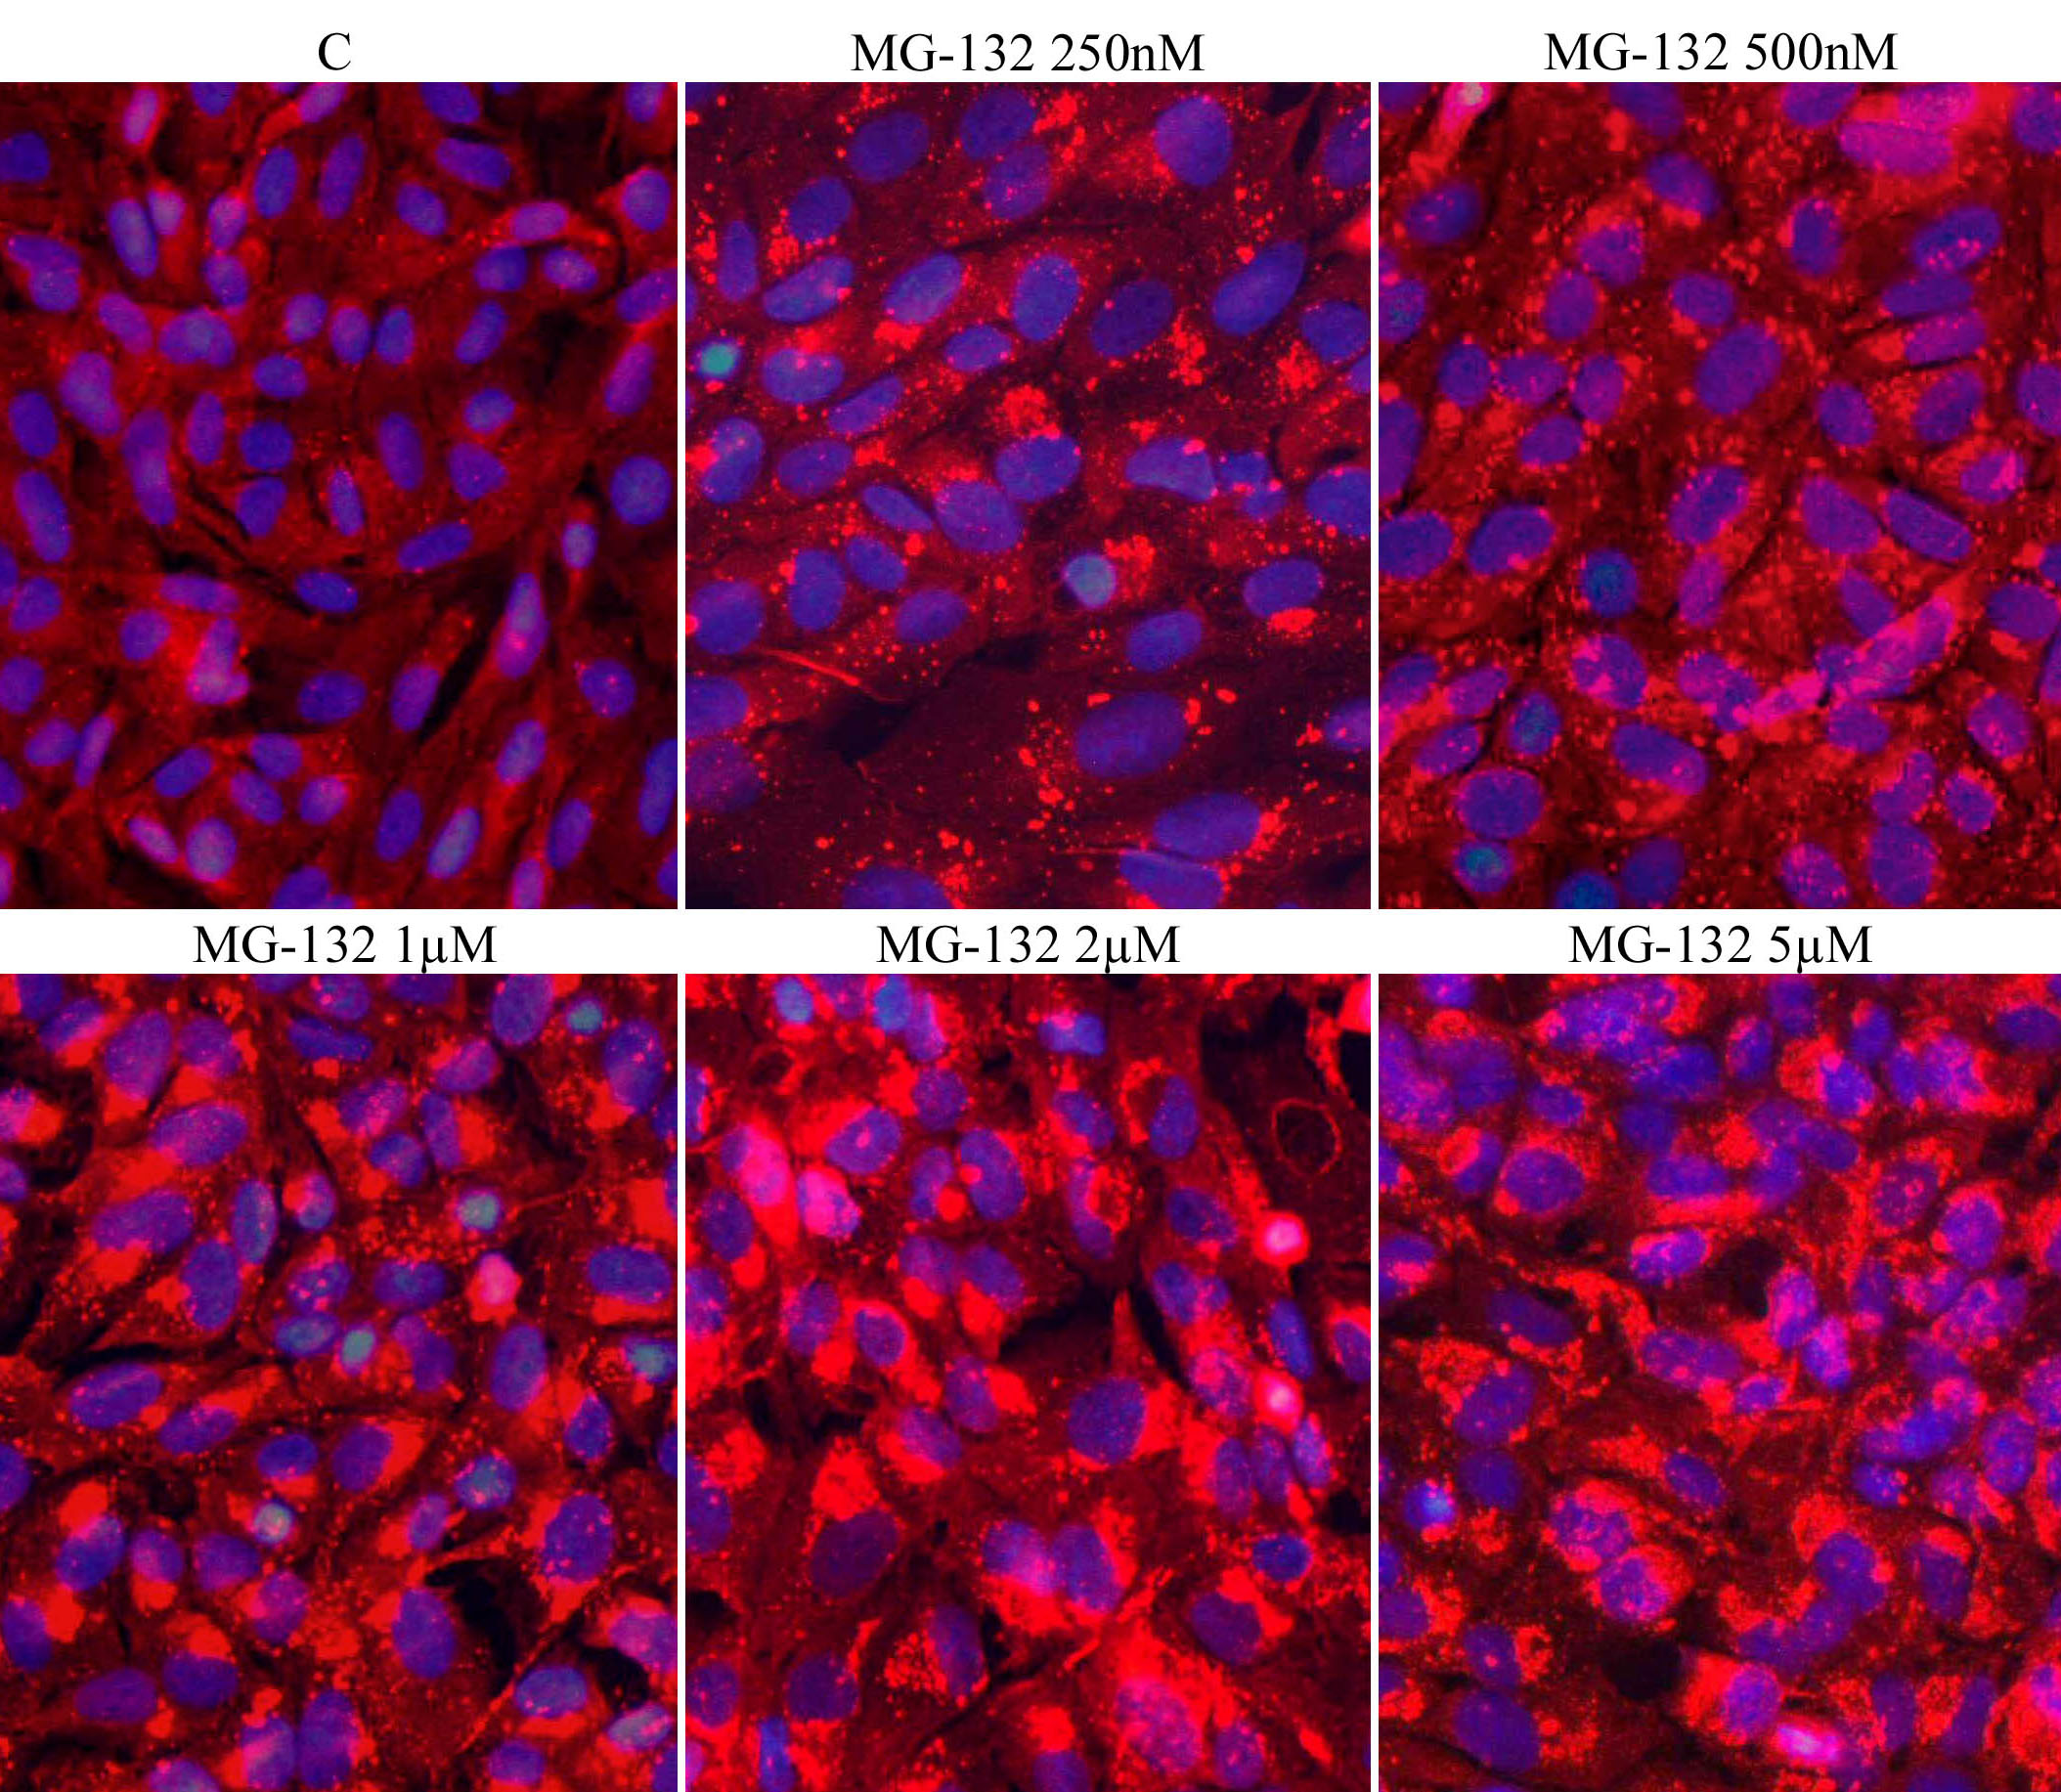
Figure 2.
Immunofluorescence microscopy analysis of p62 (red) in ARPE-19 cells. Cells were exposed to different concentrations (250 nM–5 µM) of MG-132 for 24 h. C stands for control. Nuclei are stained with blue dye.
 Figure 2 of Viiri, Mol Vis 2010; 16:1399-1414.