Figure 5. Quantitative comparison of gene expression between the treatment and control groups by real time RT–PCR. The transcript quantification
of target genes was normalized relative to the standard housekeeping gene encoding Gapdh (arbitrary units, AU). The expression of Vegfr2 and endogenous Vash1 mRNA transcripts were significantly decreased in the treatment group compared to the control group (A, B). Meanwhile, there were slightly decreased but no significant differences in the expression levels of Vegf and Vegfr1 (C, D) in the treatment versus control group (p>0.05 for both genes).
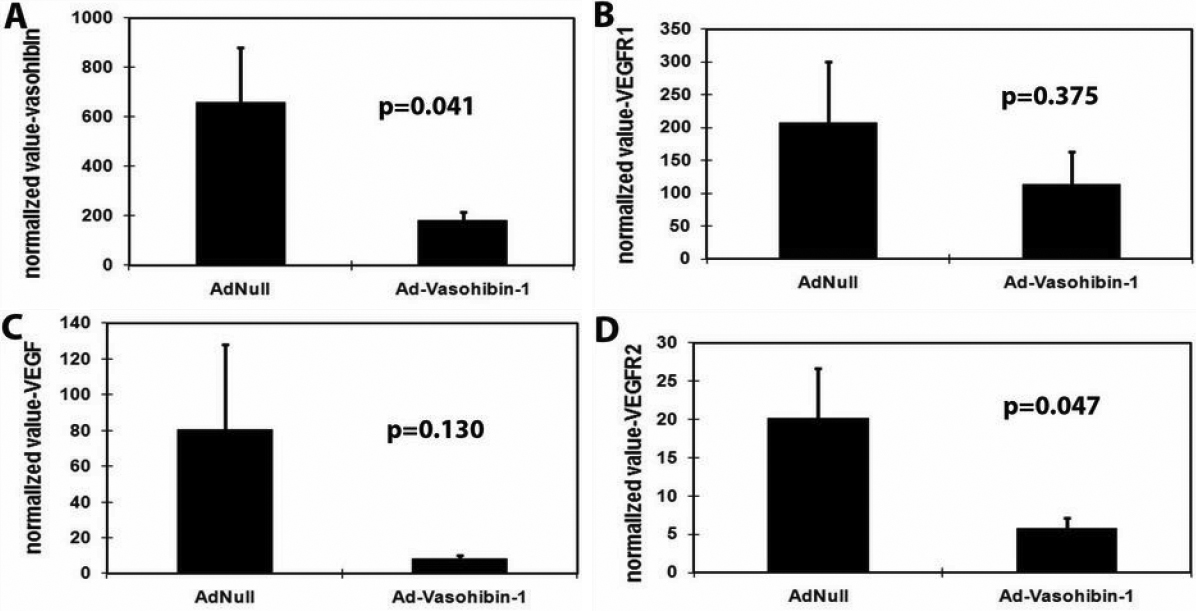
 Figure 5 of
Zhou, Mol Vis 2010; 16:1389-1398.
Figure 5 of
Zhou, Mol Vis 2010; 16:1389-1398.