Figure 5. Impact of EPA on pNF-κB in the
retina and RPE-choroid complex after LPS injection. A: Time
course of pNF-κB p65 in the Retina. Values are means±SEM (n=6 at each
time point). B: Bars represent the protein level of pNF-κB p65
in retinal tissue, 1.5 h after LPS injection. Values are means±SEM (n=4
to 10). C: Time course of pNF-κB p65 in the RPE-choroid
complex. Values are means±SEM (n=6 at each time point). D: Bars
represent the protein level of pNF-κB p65 in the RPE-choroid complex,
1.5 h after LPS injection. Values are means±SEM (n=4 to 10). †p<0.01
and *p<0.05.
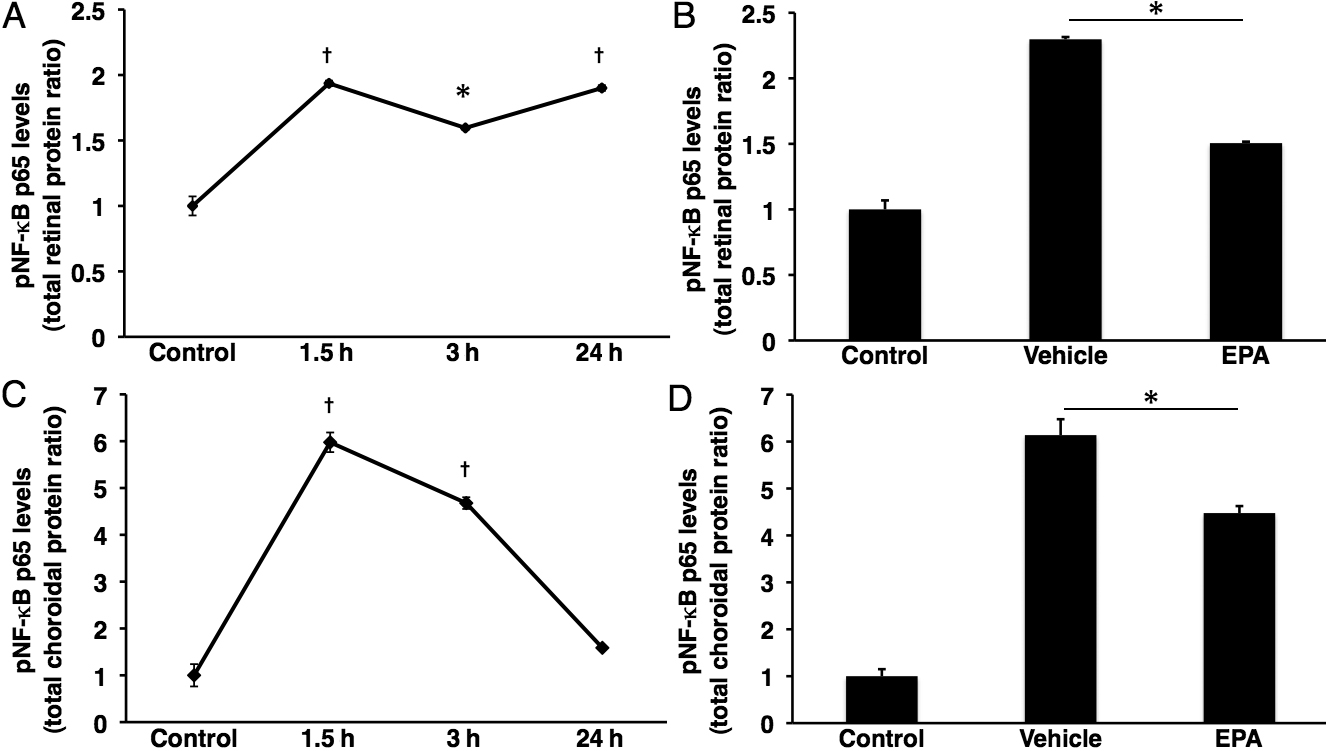
 Figure 5 of Suzuki, Mol Vis 2010; 16:1382-1388.