Figure 2. Impact of EPA on inflammatory leukocyte infiltration into the vitreous cavity. A: Representative micrographs of leukocyte infiltration into the vitreous of EIU mice with or without EPA administration. Arrows
indicate the infiltrated leukocytes in the vitreous. B: Quantification of infiltrated leukocytes in the vitreous cavity of EIU animals treated with or without EPA administration.
Values are means±SEM (n=8). *p<0.05.
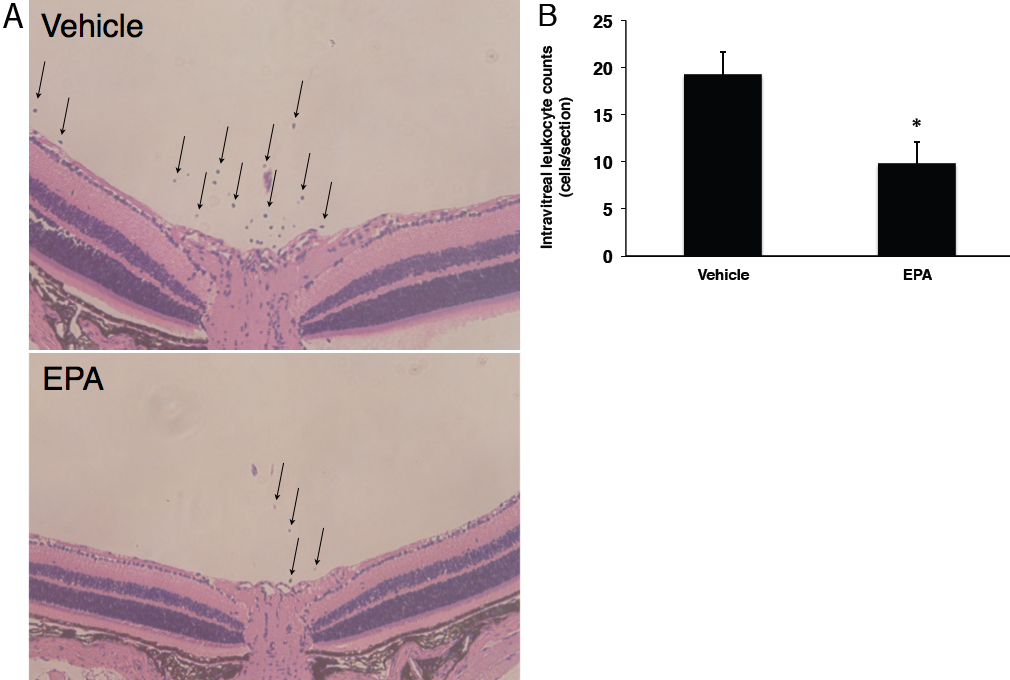
 Figure 2 of
Suzuki, Mol Vis 2010; 16:1382-1388.
Figure 2 of
Suzuki, Mol Vis 2010; 16:1382-1388.