Figure 3. The voltage activation profile
examined by tail current analysis in hemichannels from representative
cells expressing (A) Cx46 or (B) the combined cRNA
derived from the mixture of Cx43 and Cx46 (Cx43•Cx46). The
amplitude of the tail current was derived by extrapolating back to the
end of the 10 s voltage step. Continuous lines represent curves fit
with the Boltzmann equation. Although of similar shape, the curve
describing the hemicurrent recorded from oocytes expressing Cx43•46 has
a steeper slope, which reflects the difference in gating charge.
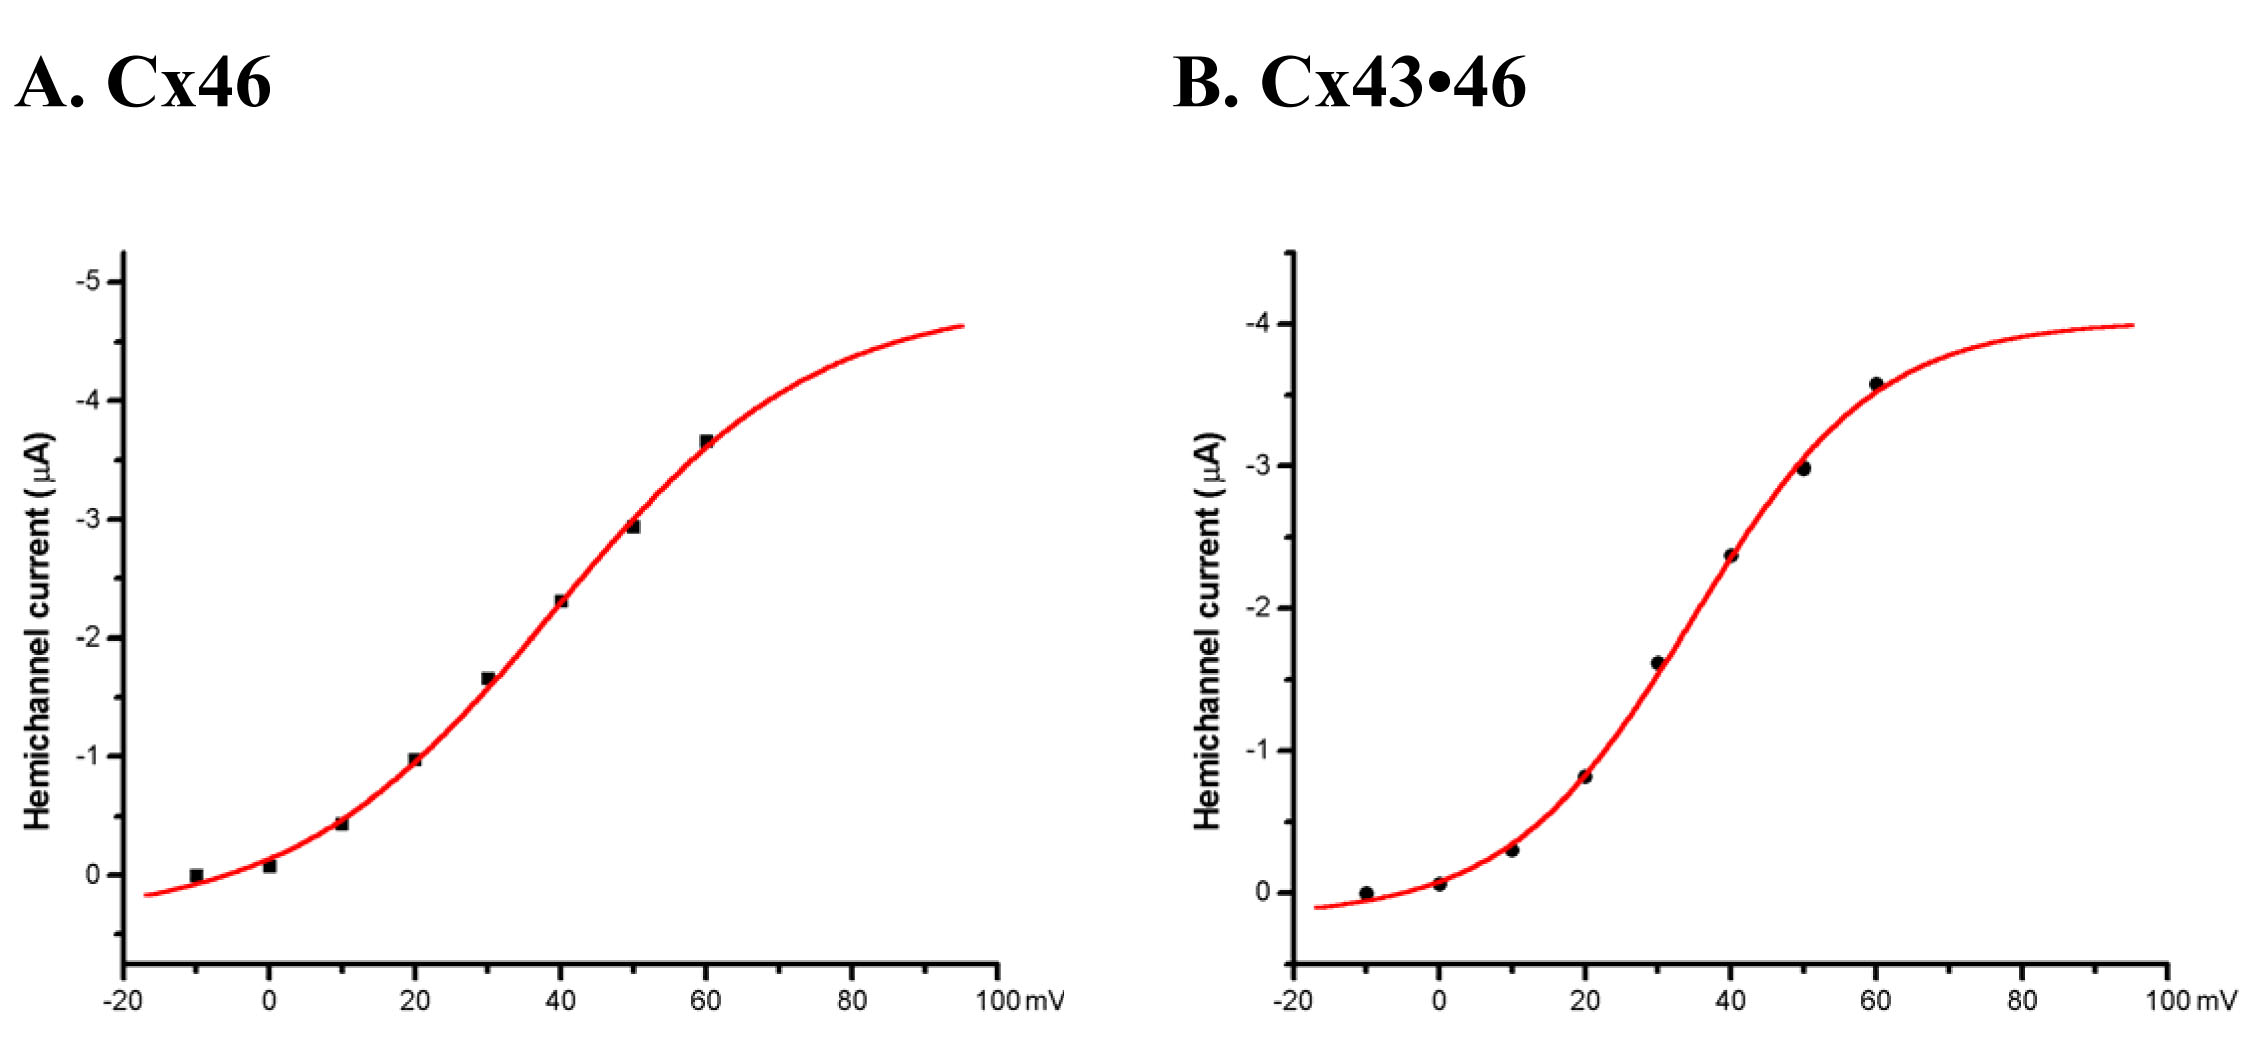
 Figure 3 of Hoang, Mol Vis 2010; 16:1343-1352.