Figure 2. Current-voltage relationships
(averaged data) for cells expressing Cx46 (n=9) and the combined cRNA
derived from the mixture of Cx43 and Cx46 (n=11). The curves for the
antisense (control, n=10) and Cx43 (n=12) injected cells remained at
baseline over the entire voltage range.
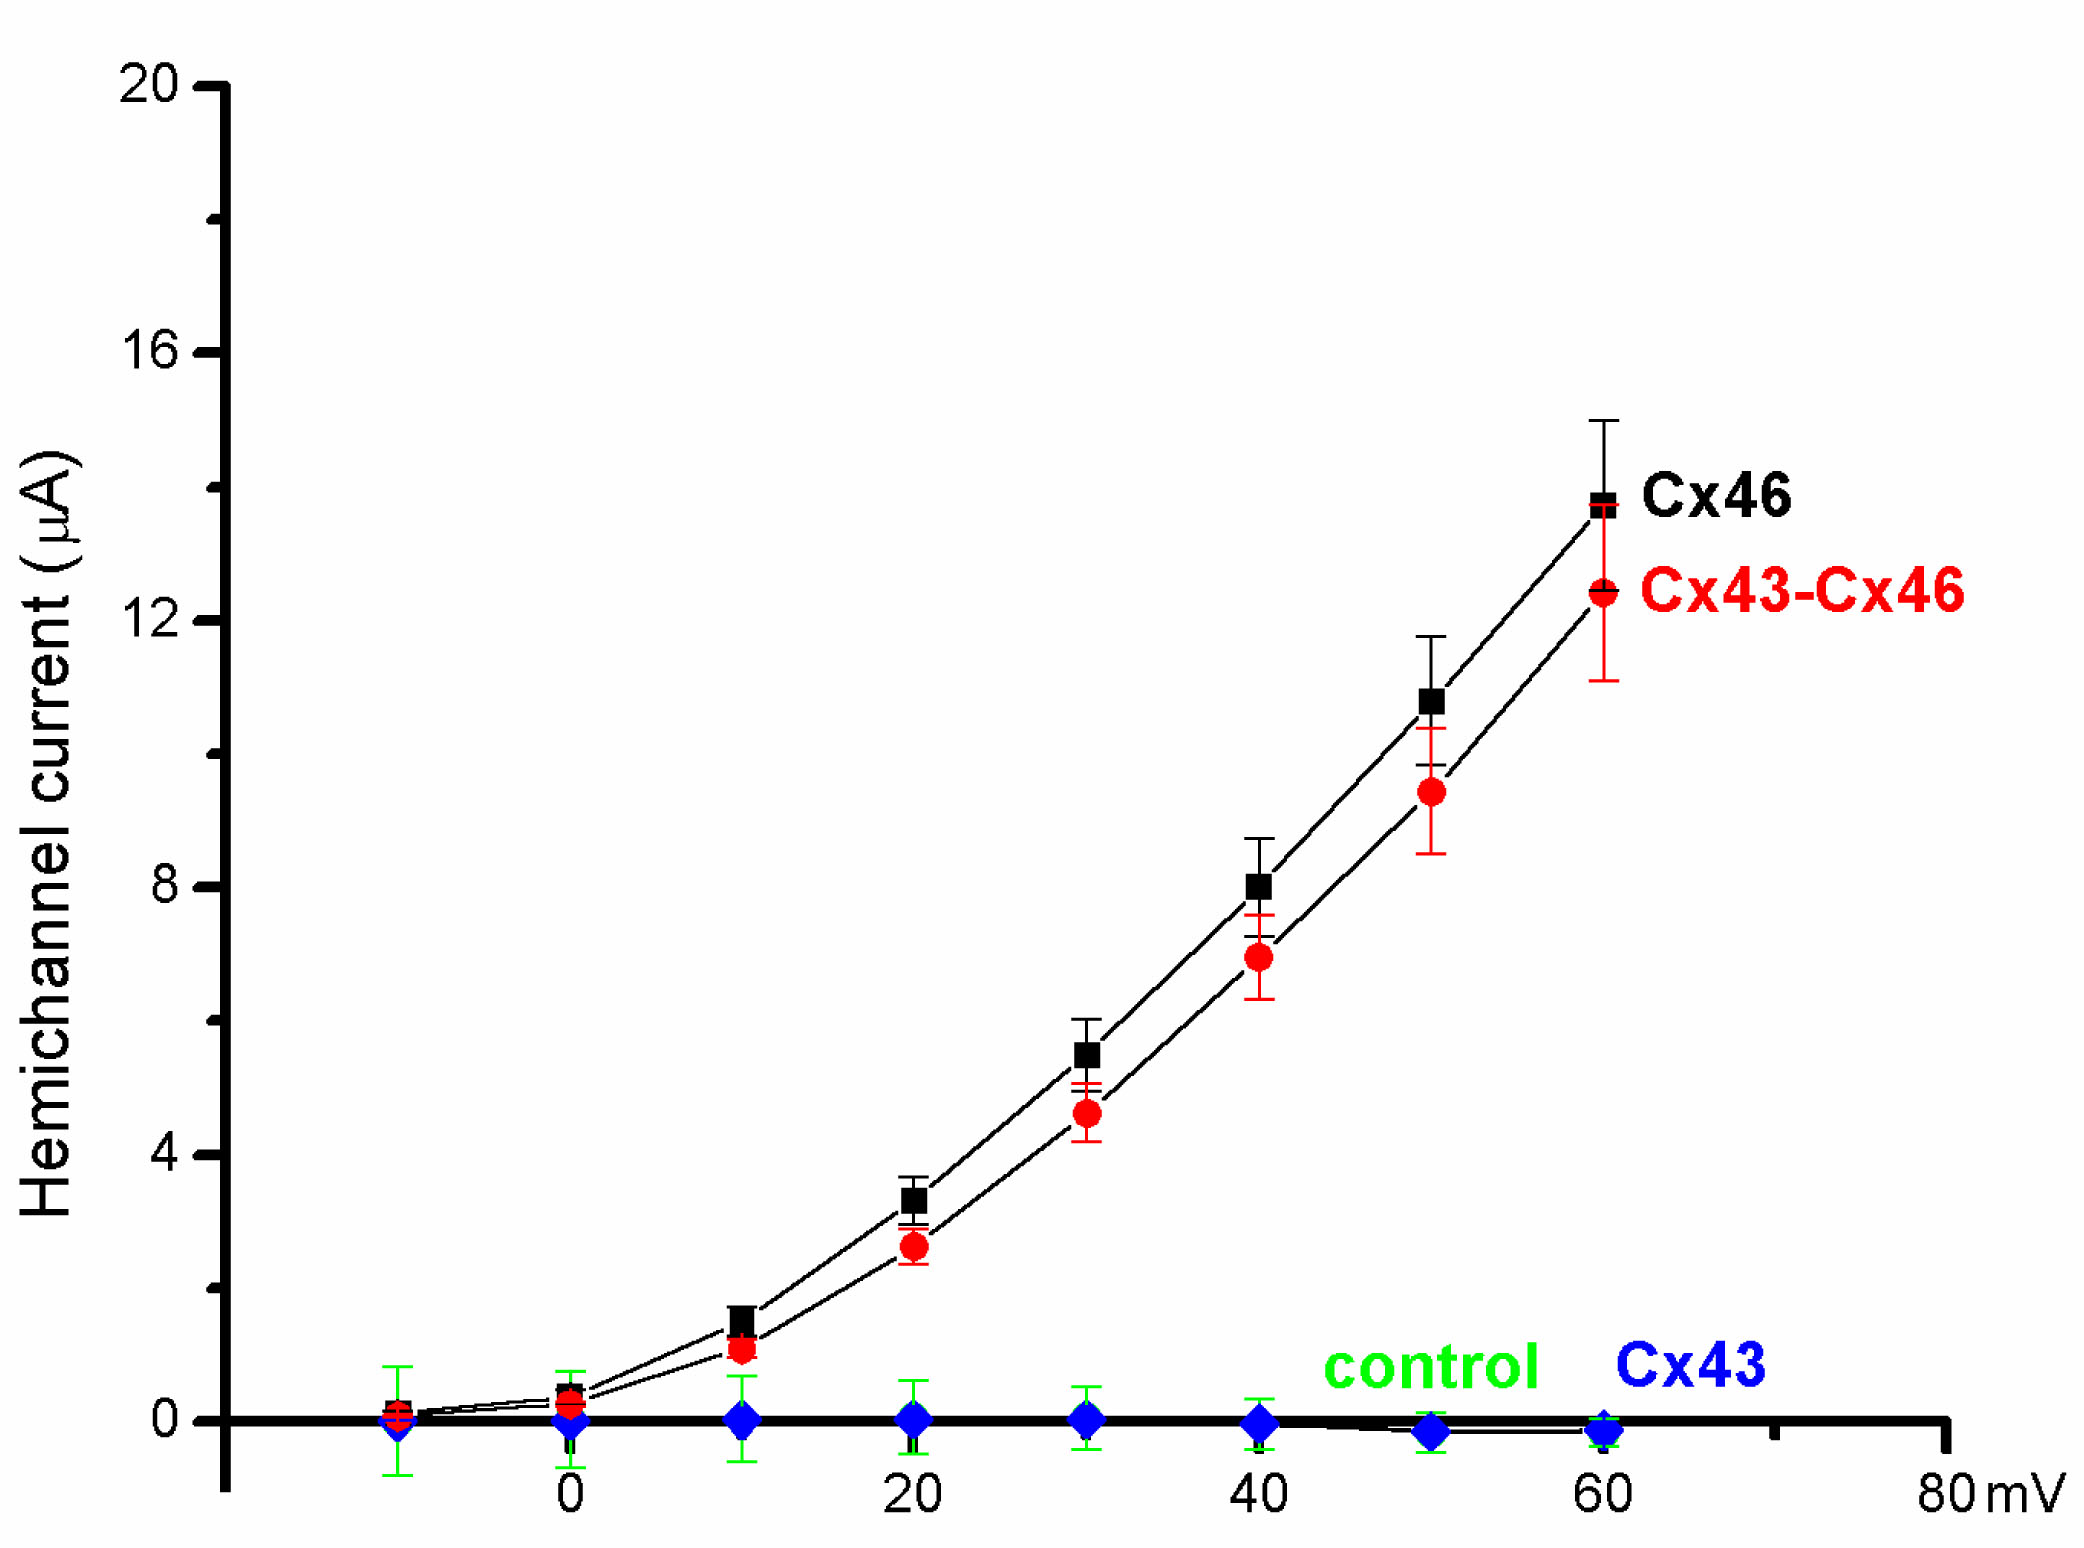
 Figure 2 of Hoang, Mol Vis 2010; 16:1343-1352.