Figure 6. Increased optic atrophy type 1 (OPA1) expression blocks apoptotic cell death in differentiated retinal ganglion cell (RGC)-5
cells exposed to elevated hydrostatic pressure (30 mmHg) for 3 days. A, B: The OPA1 antibody recognized 90-kDa (L) and 80-kDa (S) isoforms of OPA1 protein in the total protein extracts of non-pressurized
or pressurized cells transfected with AAV2 Null or AAV2-WT mOPA1. Compared with pressurized cells transfected with AAV2 Null,
pressurized cells transfected with AAV2-WT mOPA1 significantly increased both isoforms of OPA1 protein at 3 days. Data represent
the mean±SD *Significant at p<0.05 compared with pressurized cells transfected with AAV2 Null (n=4 retinas/group). C-E: Non-pressurized control cells transfected with AAV2 Null (C), pressurized cells transfected with AAV2 Null (D), and pressurized cells transfected with AAV2-WT mOPA1 (E). The cells are counterstained with Hoechst 33342. (F) The quantitative analysis of apoptotic cell death (n=200 cells per group, arrows). *Significant at p<0.05 compared with
non-pressurized control cells transfected with AAV2 Null, **Significant at p<0.05 compared with pressurized cells transfected
with AAV2 Null. Scale bar indicates 50 µm (C-E).
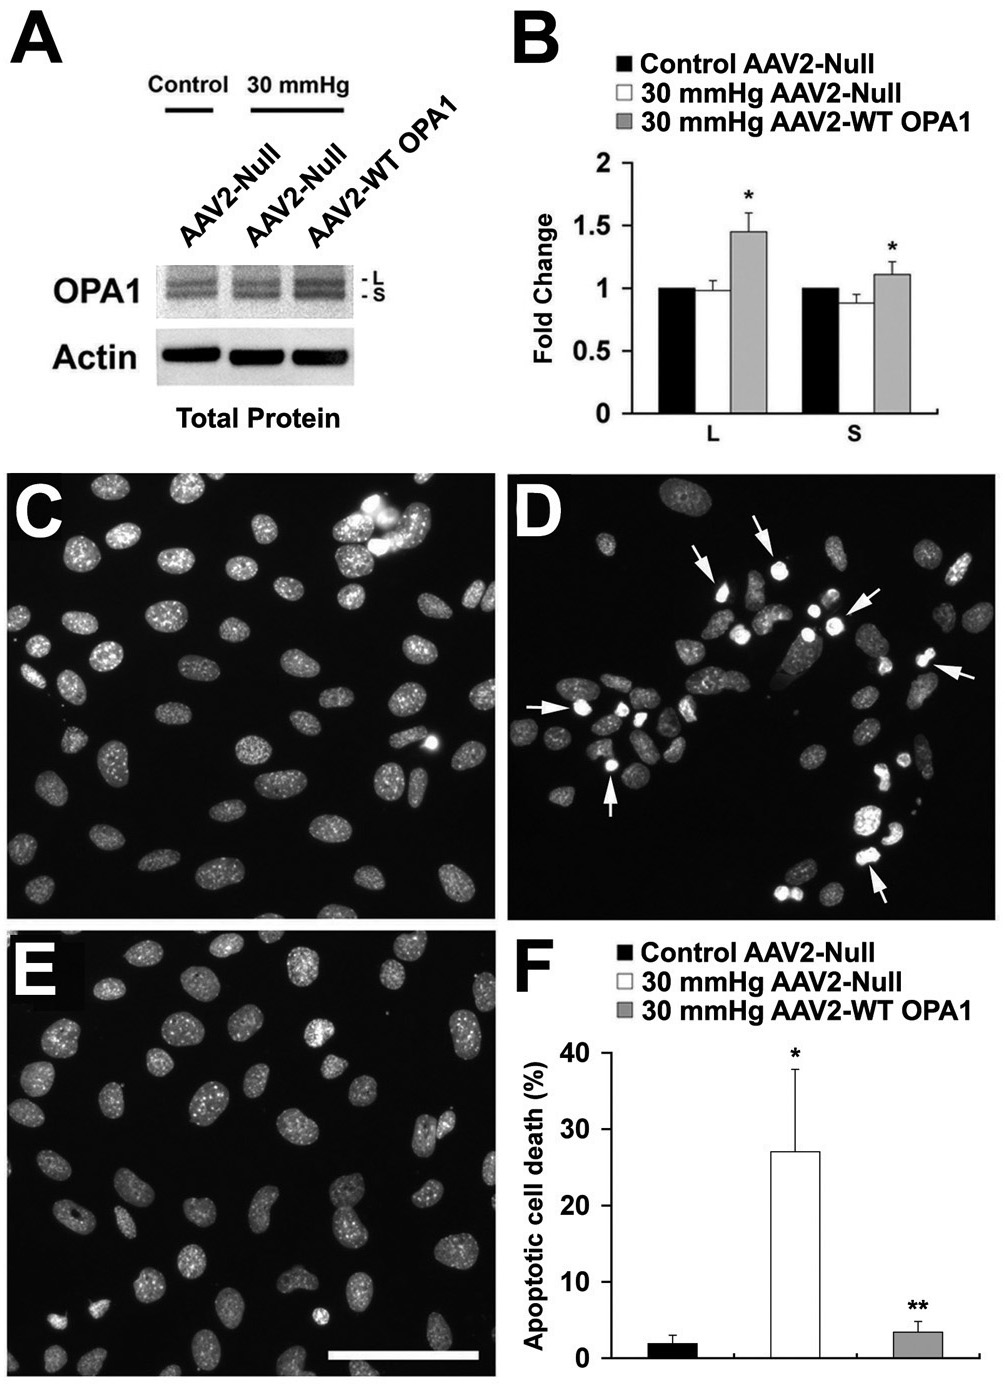
 Figure 6 of
Ju, Mol Vis 2010; 16:1331-1342.
Figure 6 of
Ju, Mol Vis 2010; 16:1331-1342.