Figure 5. Increased optic atrophy type 1 (OPA1) expression inhibits activation of astroglia and microglia in the retinas of glaucomatous
DBA/2J mice. A, B: Adeno-associated virus serotype 2-wild type (AAV2-WT) mOPA1-trasfected glaucomatous mice significantly decreased GFAP protein
compared with glaucomatous DBA/2J mice treated with AAV2 Null. Relative intensity of chemiluminescence for each protein band
was normalized with actin used as the calibrator; n=4 retinas/group. Data represent the mean±SD *Significant at p<0.05 compared
with glaucomatous DBA/2J mice transfected with AAV2-CMV Null. C, D: Glaucomatous retina transfected with AAV2 Null exhibited significantly induced activations of both astroglia (green, C) and microglia (red, D). E: Merged retina with triple labeling. F, G: Glaucomatous retina transfected with AAV2-WT mOPA1 significantly reduced activation of both astroglia (green, F) and microglia (red, G). H: Merged retina with triple labeling. The blue color shows FluroGold-labeled RGCs. Scale bar indicates 50 µm (C-H).
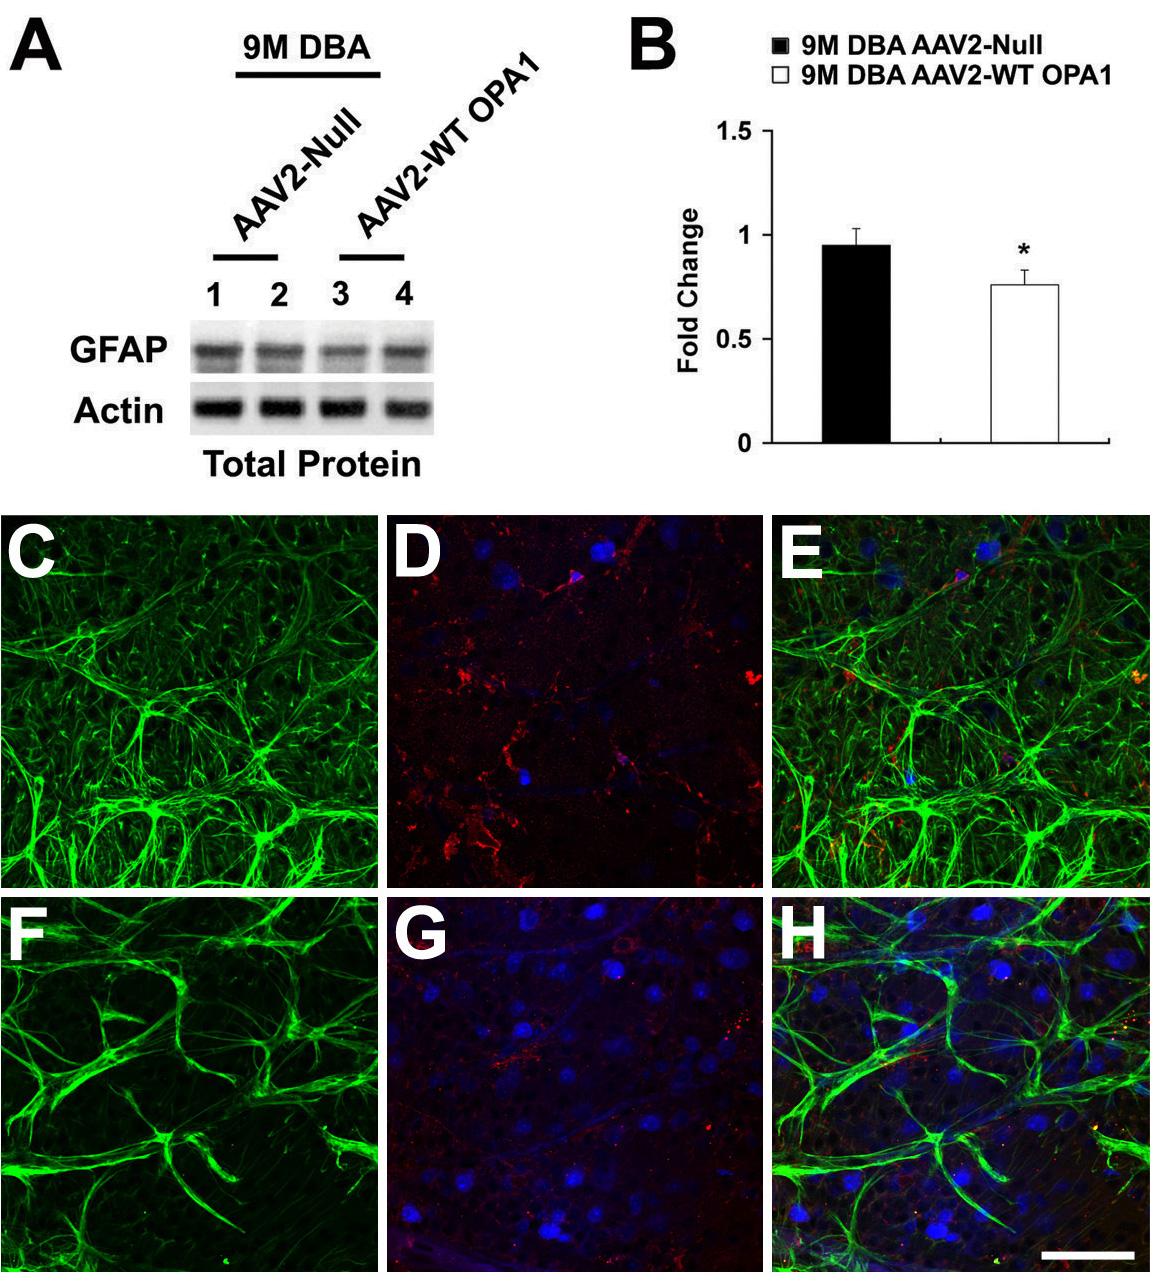
 Figure 5 of
Ju, Mol Vis 2010; 16:1331-1342.
Figure 5 of
Ju, Mol Vis 2010; 16:1331-1342.