Figure 2. Relationship of ARMS2
and HTRA1 expression in the human placenta to the genotypes at
10q26. We show the effect of AMD-associated variants near ARMS2
and HTRA1 genes on ARMS2 and HTRA1 expression
in human placenta samples. A-D: The fold change in
expression of the target genes (ARMS2, HTRA1, HPRT1, and GAPDH)
relative
to the internal control gene (rRNA) were correlated to
genotypes of corresponding placenta samples. Real-time qRT–PCR
reactions were performed in quadruplicate with Taqman gene expression
or SYBR Green assays. The fold change average in the expression of the
target gene was calculated using the 2-ddCt method; ddCt=(Ct,Target
-
Ct,rRNA)experiment - (Ct,Target - Ct,rRNA)reference.
Gene
expressions in wild-type (having common variants at all four
genotyped loci) placentas were used as a reference. cBlack unique
symbols (e.g., triangle, square, diamond, dash, X’s cross, circle)
indicate individual sample changes, and white square shows the average.
Abbreviations: N represents number of samples with given genotypes; P
represents polymorphism (P/P represents homozygous; P/- represents
heterozygous change. Variants are shown in the left column).
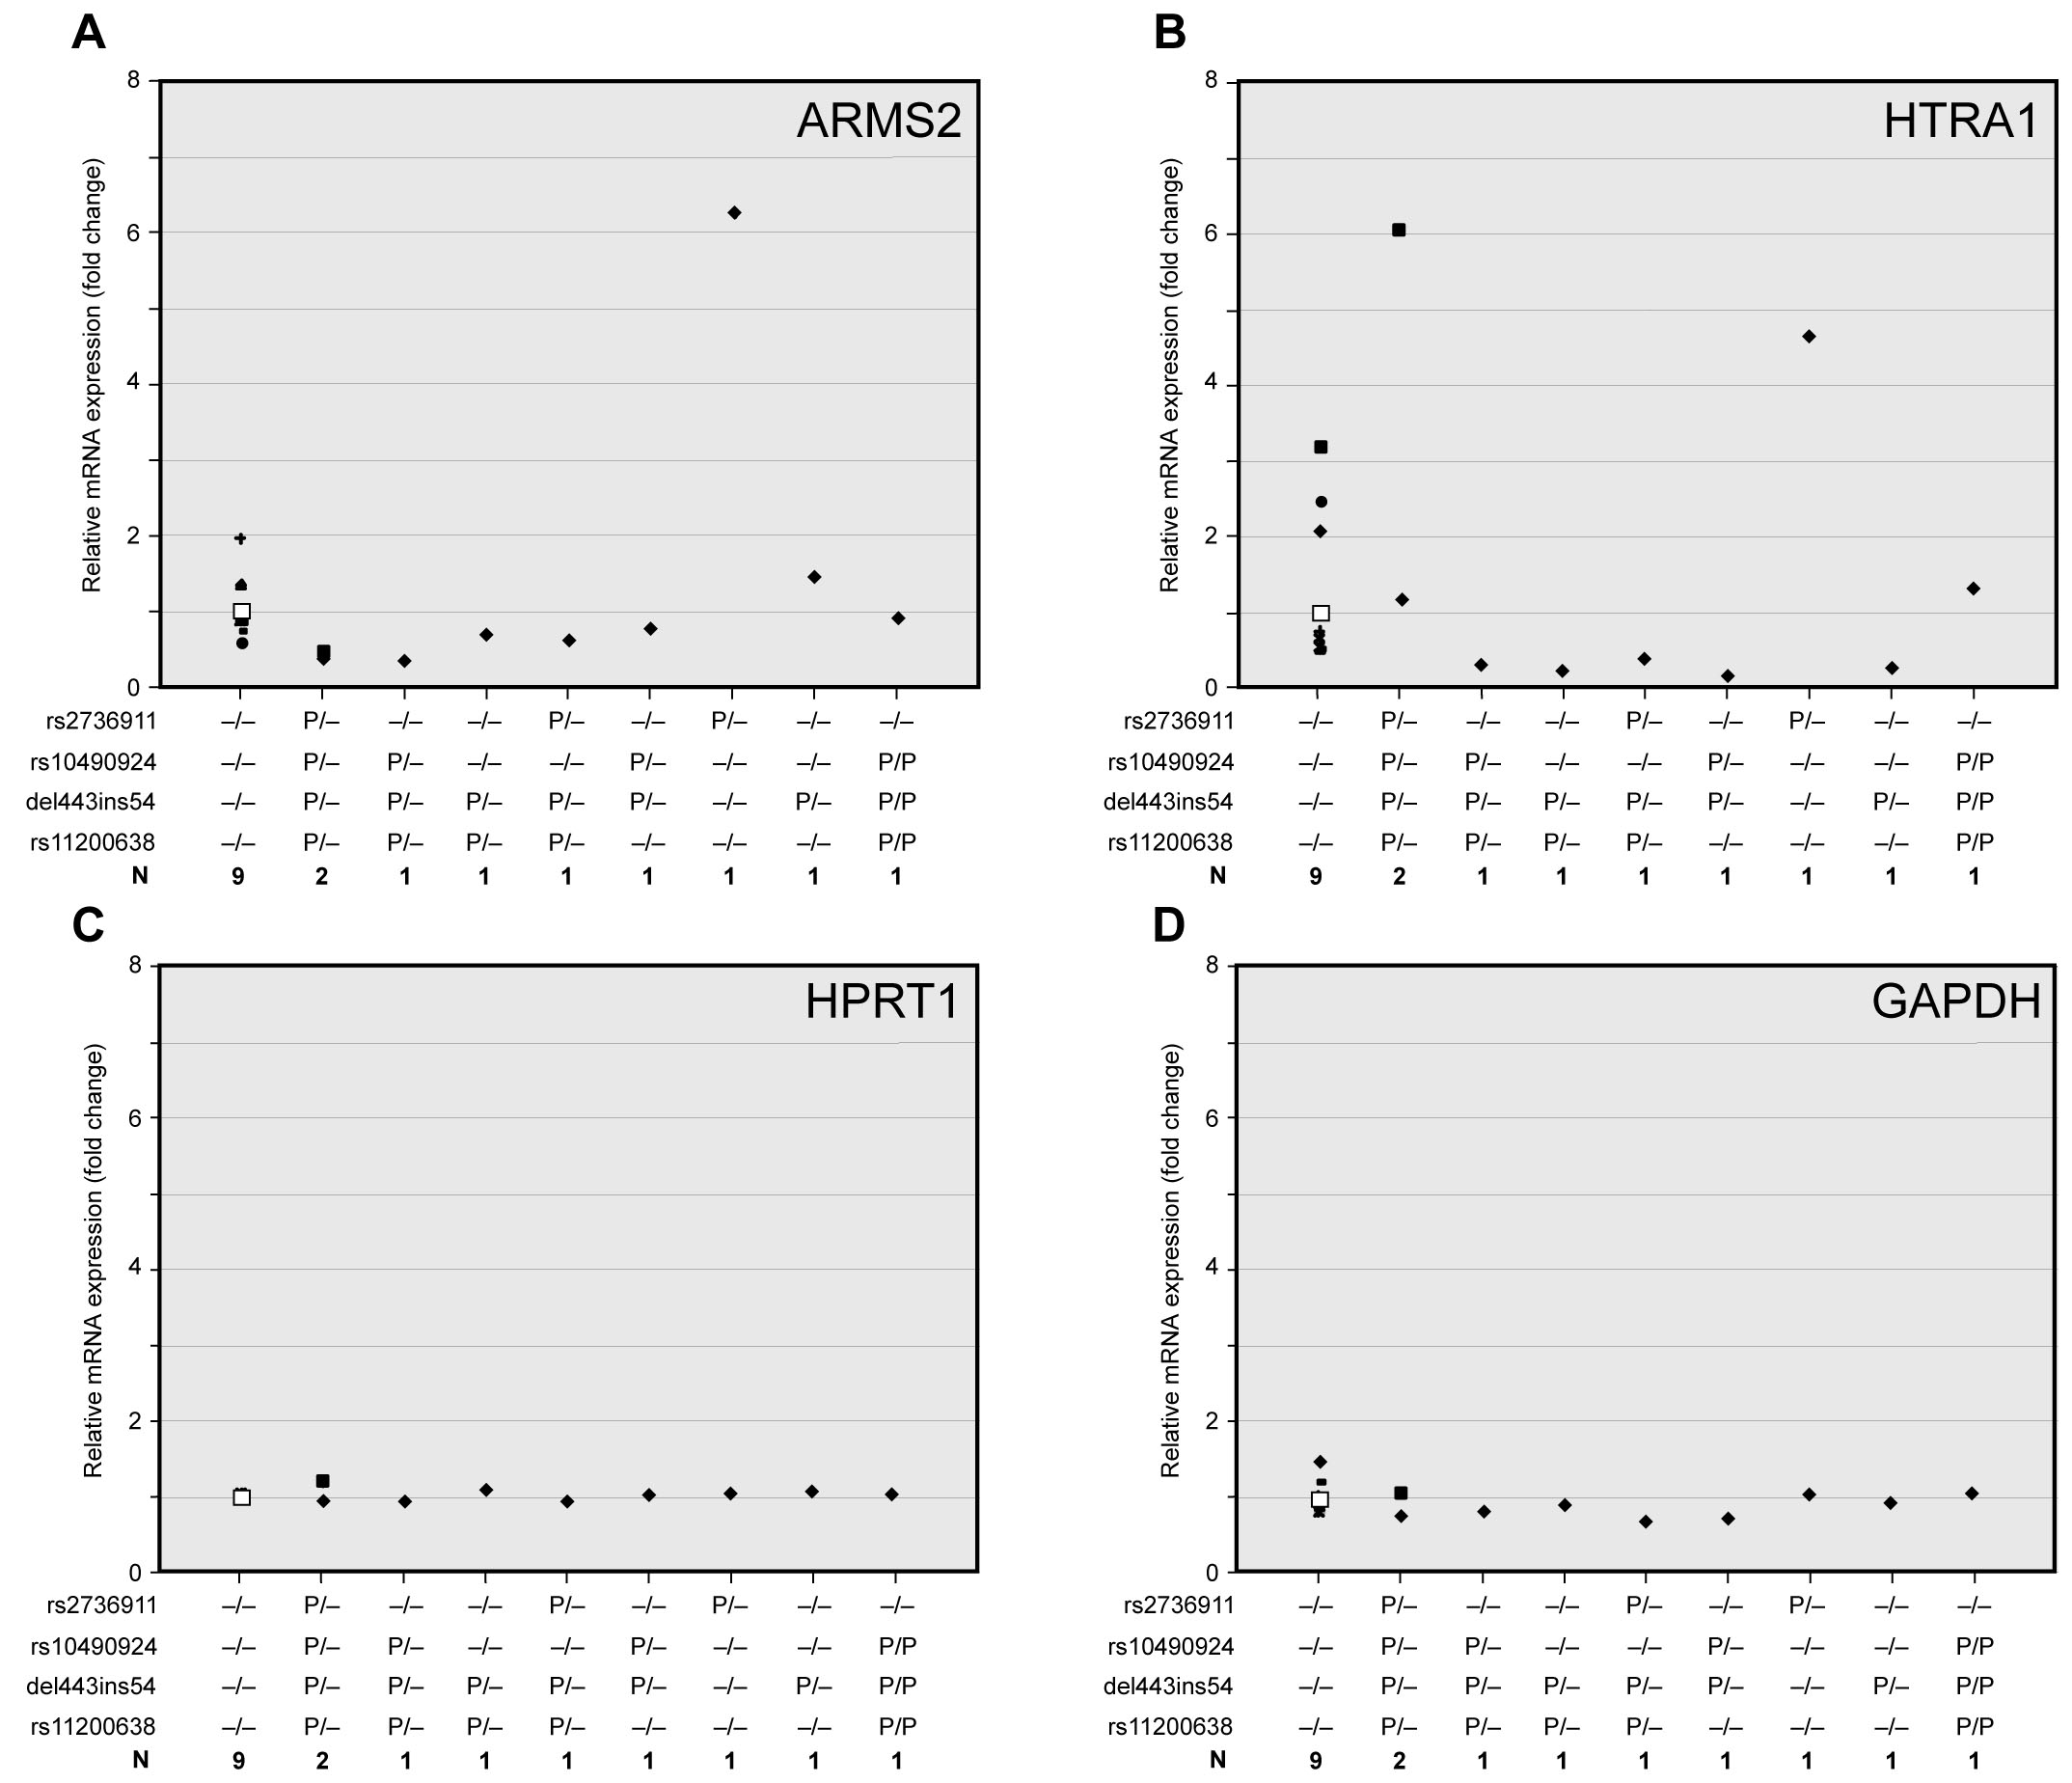
 Figure 2 of Kanda, Mol Vis 2010; 16:1317-1323.