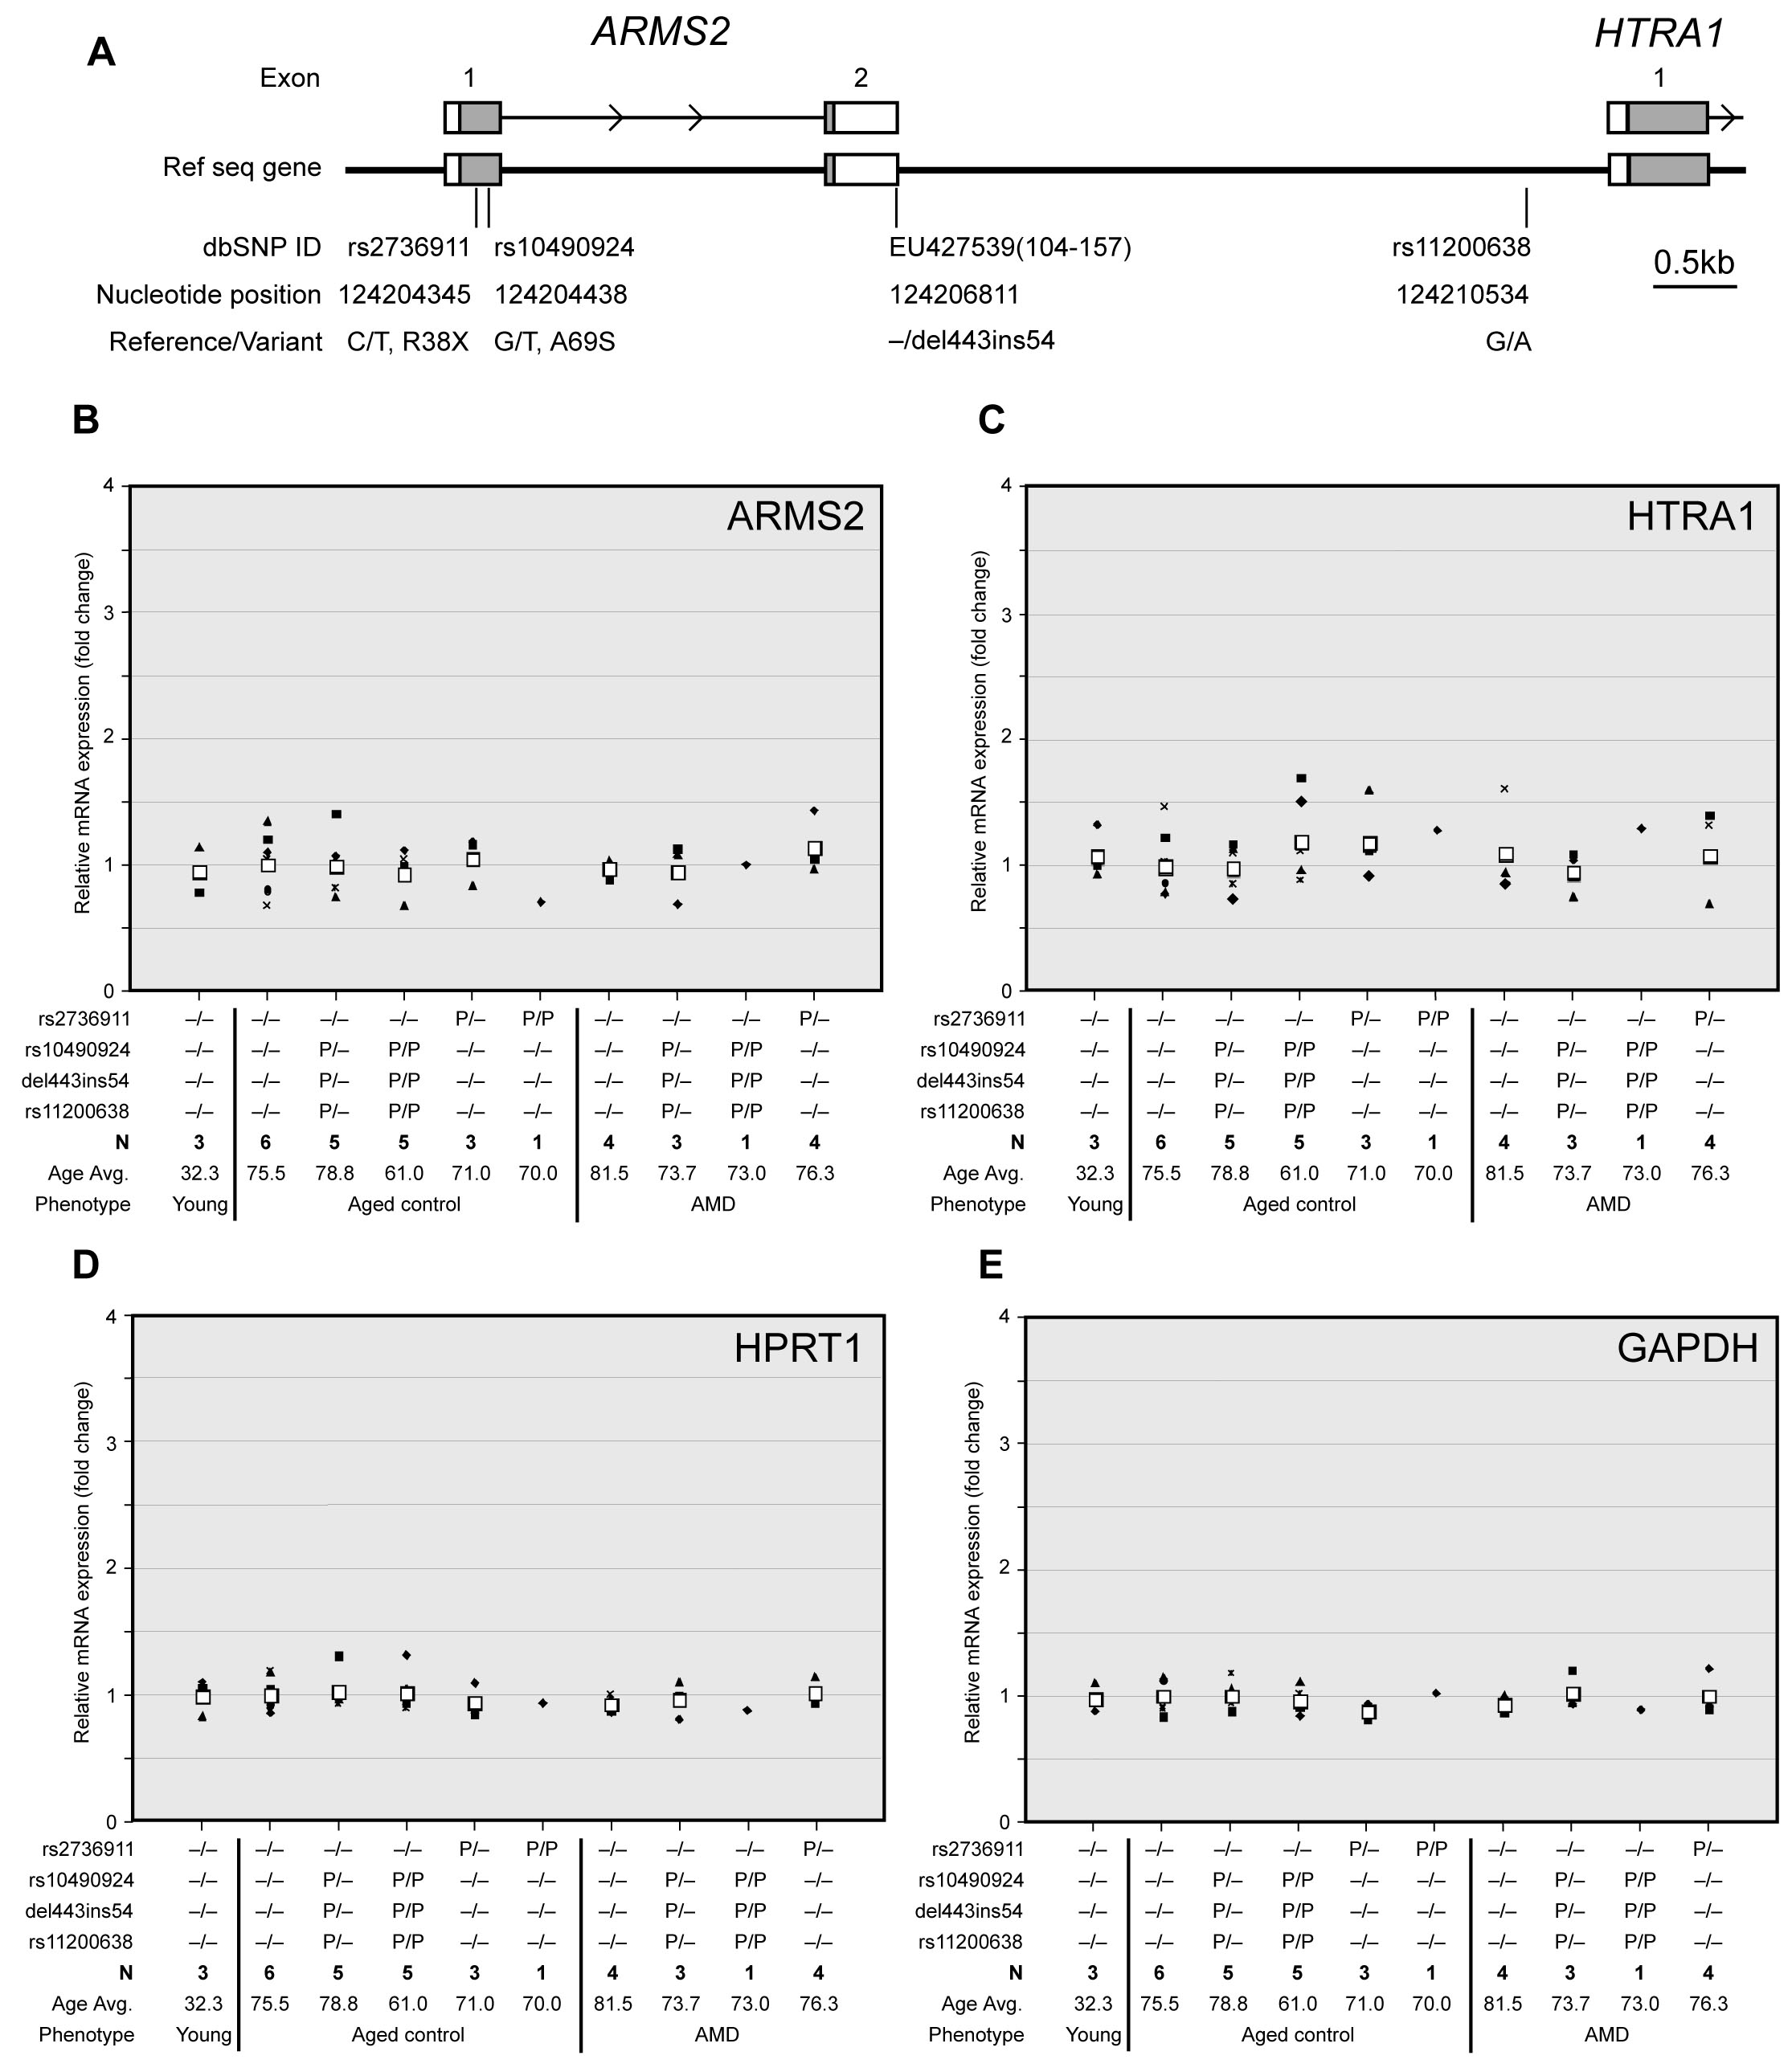
Figure 1. Relationship of
ARMS2
and
HTRA1 expression in the human retina to the genotypes at
10q26.
A: Schematic representation of positions of polymorphic
variants at chromosome 10q26. White boxes indicate exons and gray shows
translated regions. Numbers indicate the nucleotide position in
NT_030059.12
(NCBI Reference Sequence).
B-
E: Gene expression in the
human retina. We investigated the effect of AMD-associated variants
near
ARMS2 and
HTRA1 genes on expression levels of
ARMS2
and
HTRA1 in human retina samples. Fold changes in expression
of the target genes (
ARMS2,
HTRA1,
HPRT1, and
GAPDH)
relative
to the internal control gene (
rRNA) were correlated to
the genotypes of four polymorphisms at 10q26. The samples were analyzed
after qRT–PCR reactions performed in quadruplicate with Taqman gene
expression or SYBR Green assays. The fold change average in expression
of the target gene was calculated using the 2
-ddCt method;
ddCt=(C
t,Target - C
t,rRNA)
experiment -
(C
t,Target - C
t,rRNA)
reference. Gene
expressions in wild-type (with common variants at the four loci) older
normal retinas were used as a reference. Black unique symbols (e.g.,
triangle, square, diamond, dash, X’s cross, circle) indicate individual
sample changes, and white square shows the average. Abbreviations: Avg.
represents average; N represents number of samples with a given
genotype; P represents polymorphism (P/P represents homozygous; P/-
represents heterozygous change. Variants are in the left column).
 Figure 1 of Kanda, Mol Vis 2010; 16:1317-1323.