Figure 1. Relative degree of gene
expression by qPCR. Validation of upregulation of gene expression for CHK1
and CDC25C with qRT–PCR using independent normal retina (494N,
498N) and RB (494T, 498T, 119T, 124T, 131T, 154T, 155T, and 167T)
samples. The relative quantity (RQ) value is compared to that of normal
retina 494N. The error bars represent standard deviation from the mean.
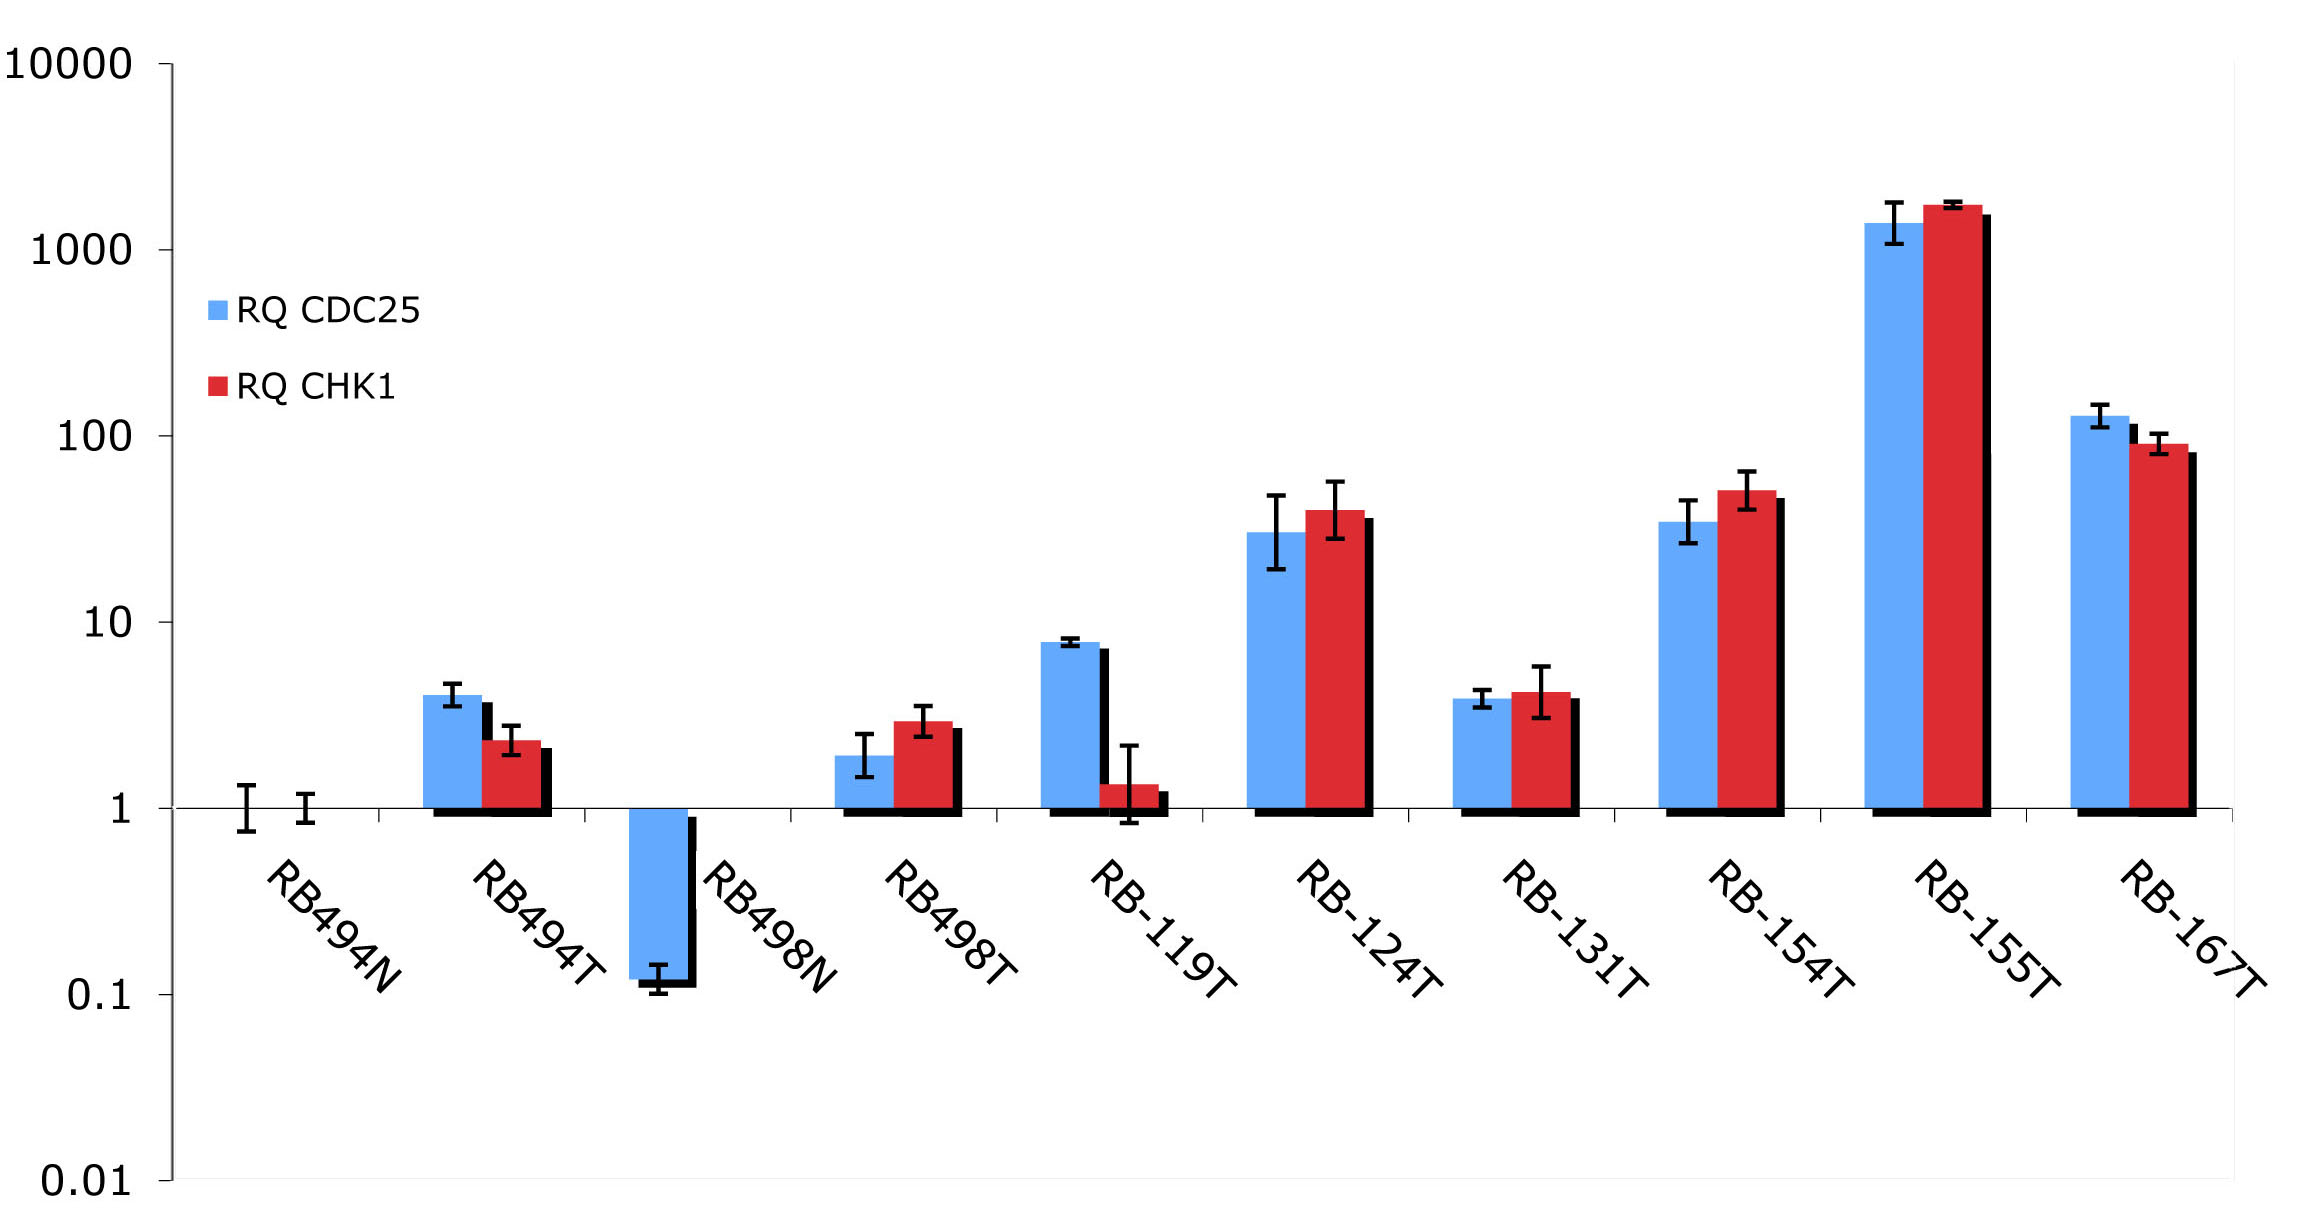
 Figure 1 of Ganguly, Mol Vis 2010; 16:1292-1303.