Figure 1. Comparison of number of copies
of endothelin-1 (ET-1) mRNA in patients and controls. Statistical
significance was found for control versus nonproliferative diabetic
retinopathy (NPDR; p=0.036), control versus proliferative diabetic
retinopathy (PDR; p=0.026), diabetes mellitus (DM) without DR versus
NPDR (p=0.005), and DM without DR versus PDR (p=0.007). Boxes and
whisker plots present medians±quartiles and minimum-maximum values of
copy number per 1 μg total RNA.
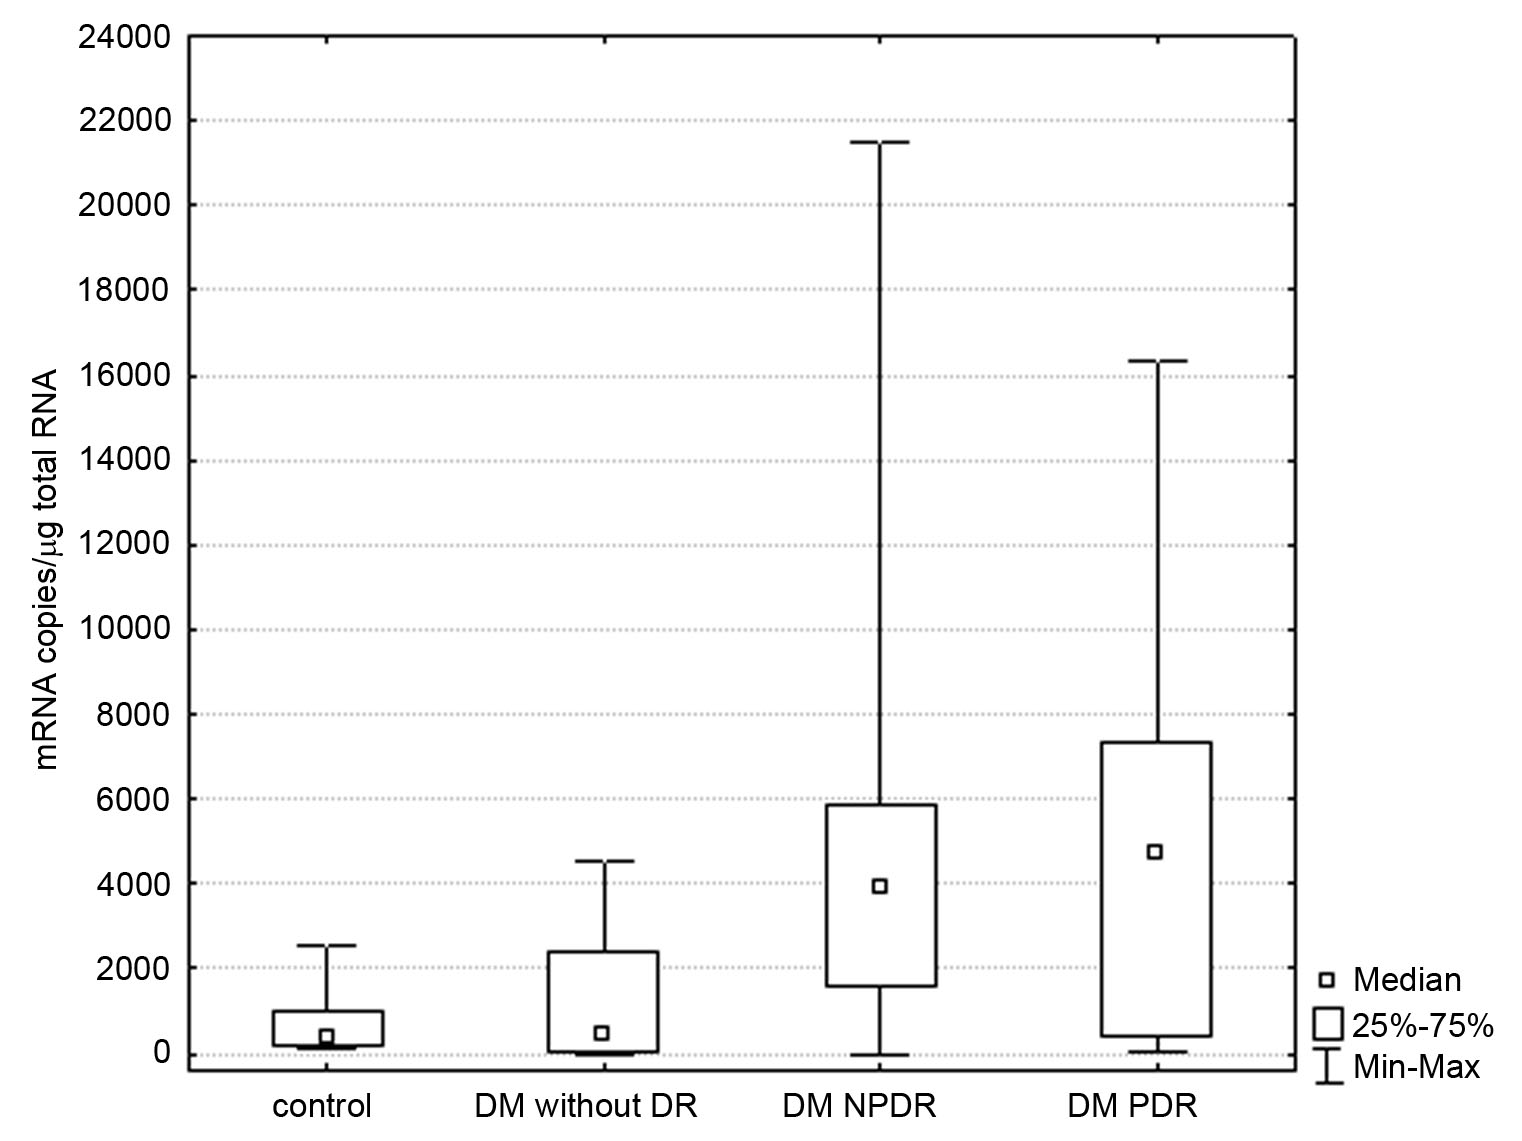
 Figure 1 of Strzalka-Mrozik, Mol Vis 2010; 16:1272-1279.