Figure 5. A: Time-course of
increase in cGMP induced by CNP fragment in CEPI-17-CL4 cells is shown.
Cyclic GMP concentration was measured after the cells were treated with
CNP fragment for the indicated period. Each symbol represents a single
datum point determined in duplicate. B and C: Effects
of NPs on cGMP production in human p-CEPI and CEPI-17-CL4 cells
are shown. Cyclic GMP concentration was measured after the cells were
treated with the indicated concentrations of various NPs for 15 min.
Each symbol represents a single datum point determined in duplicate.
Results were obtained in 4 independent studies for CEPI-17-CL4 cells (B)
and
3
independent
studies for human p-CEPI cells (C).
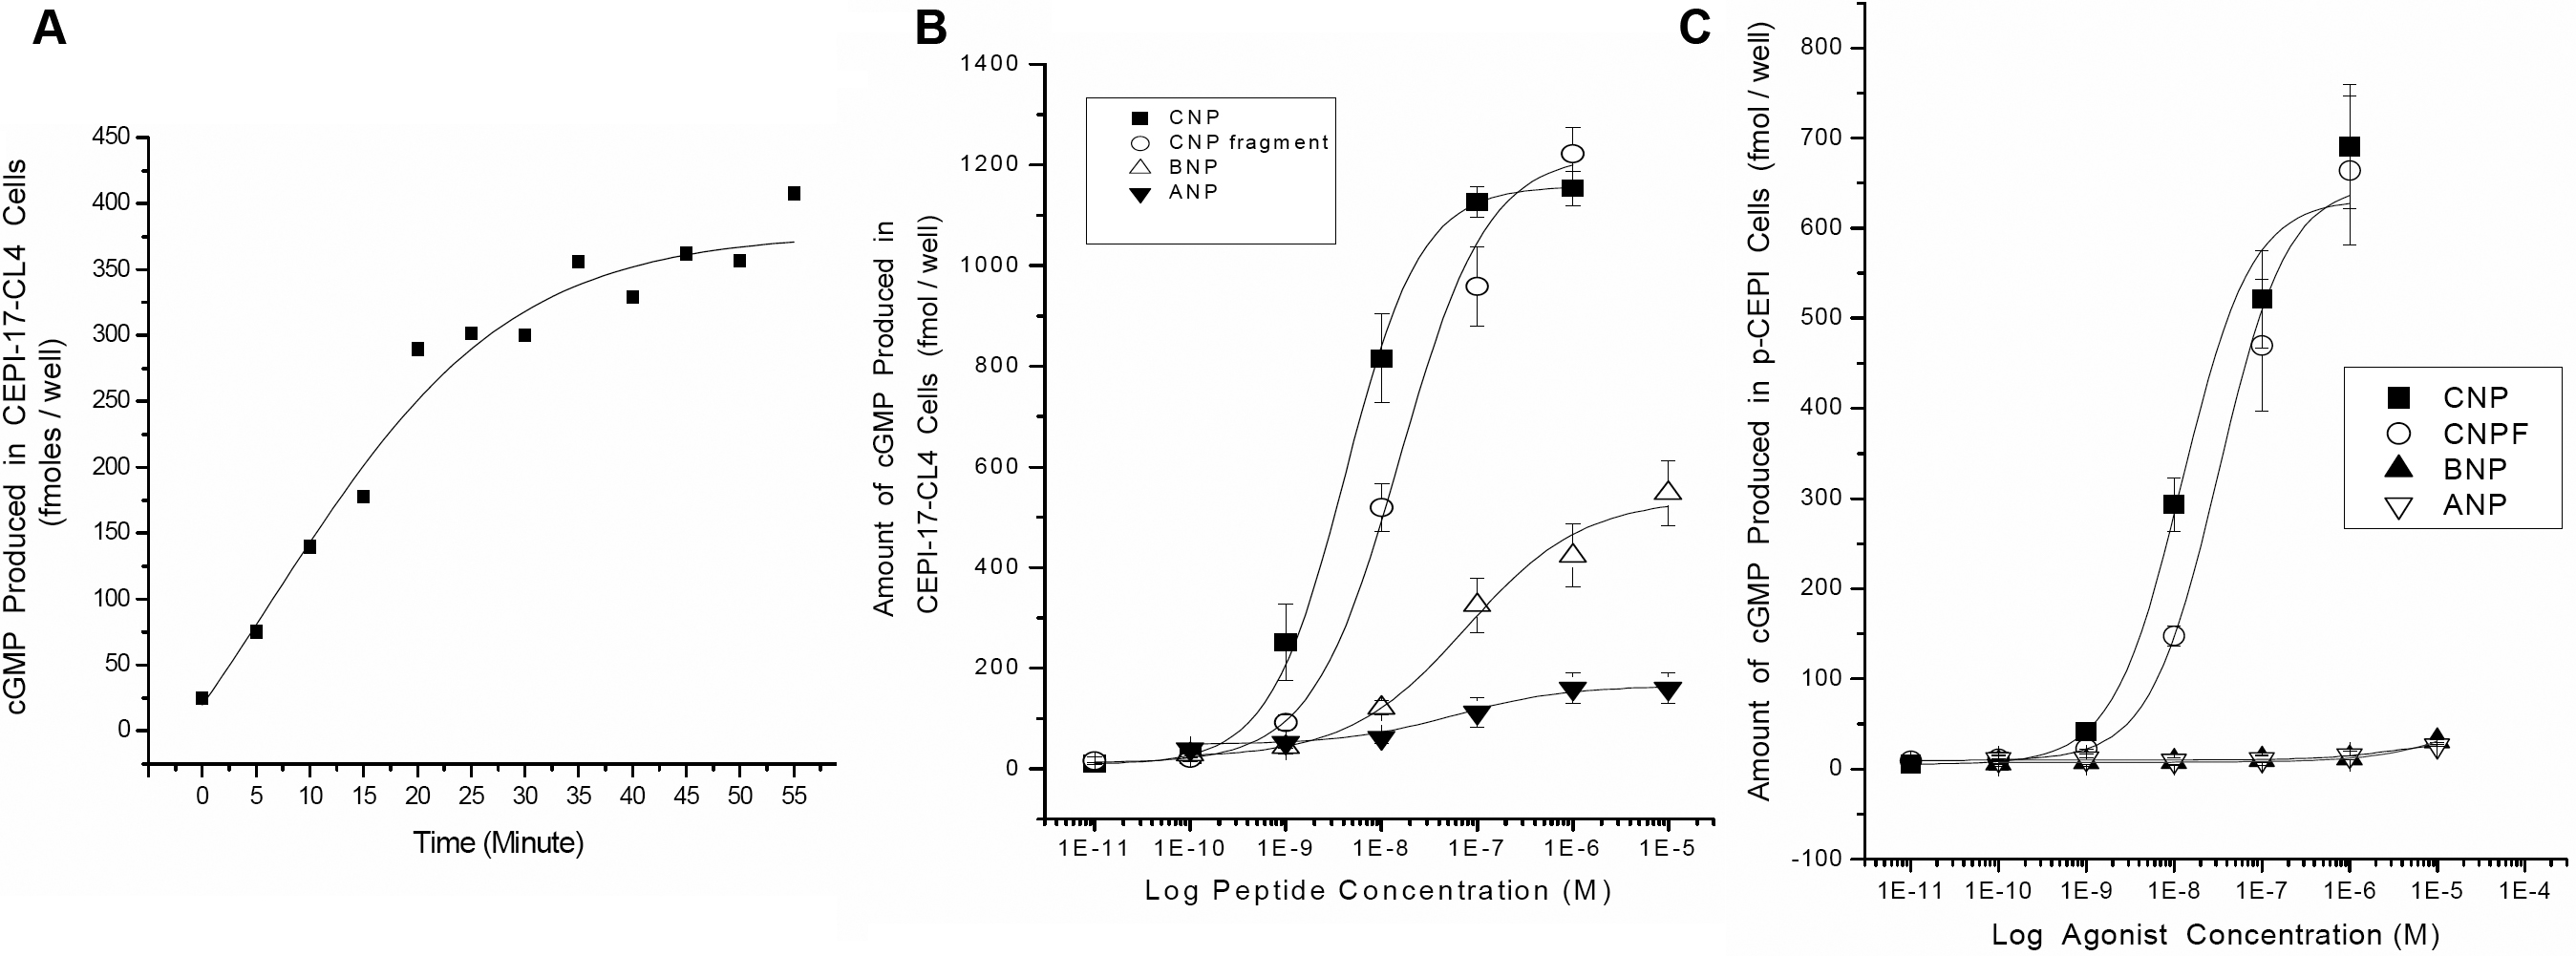
 Figure 5 of Katoli, Mol Vis 2010; 16:1241-1252.