Figure 3 of
Polisetti, Mol Vis 2010; 16:1227-1240.
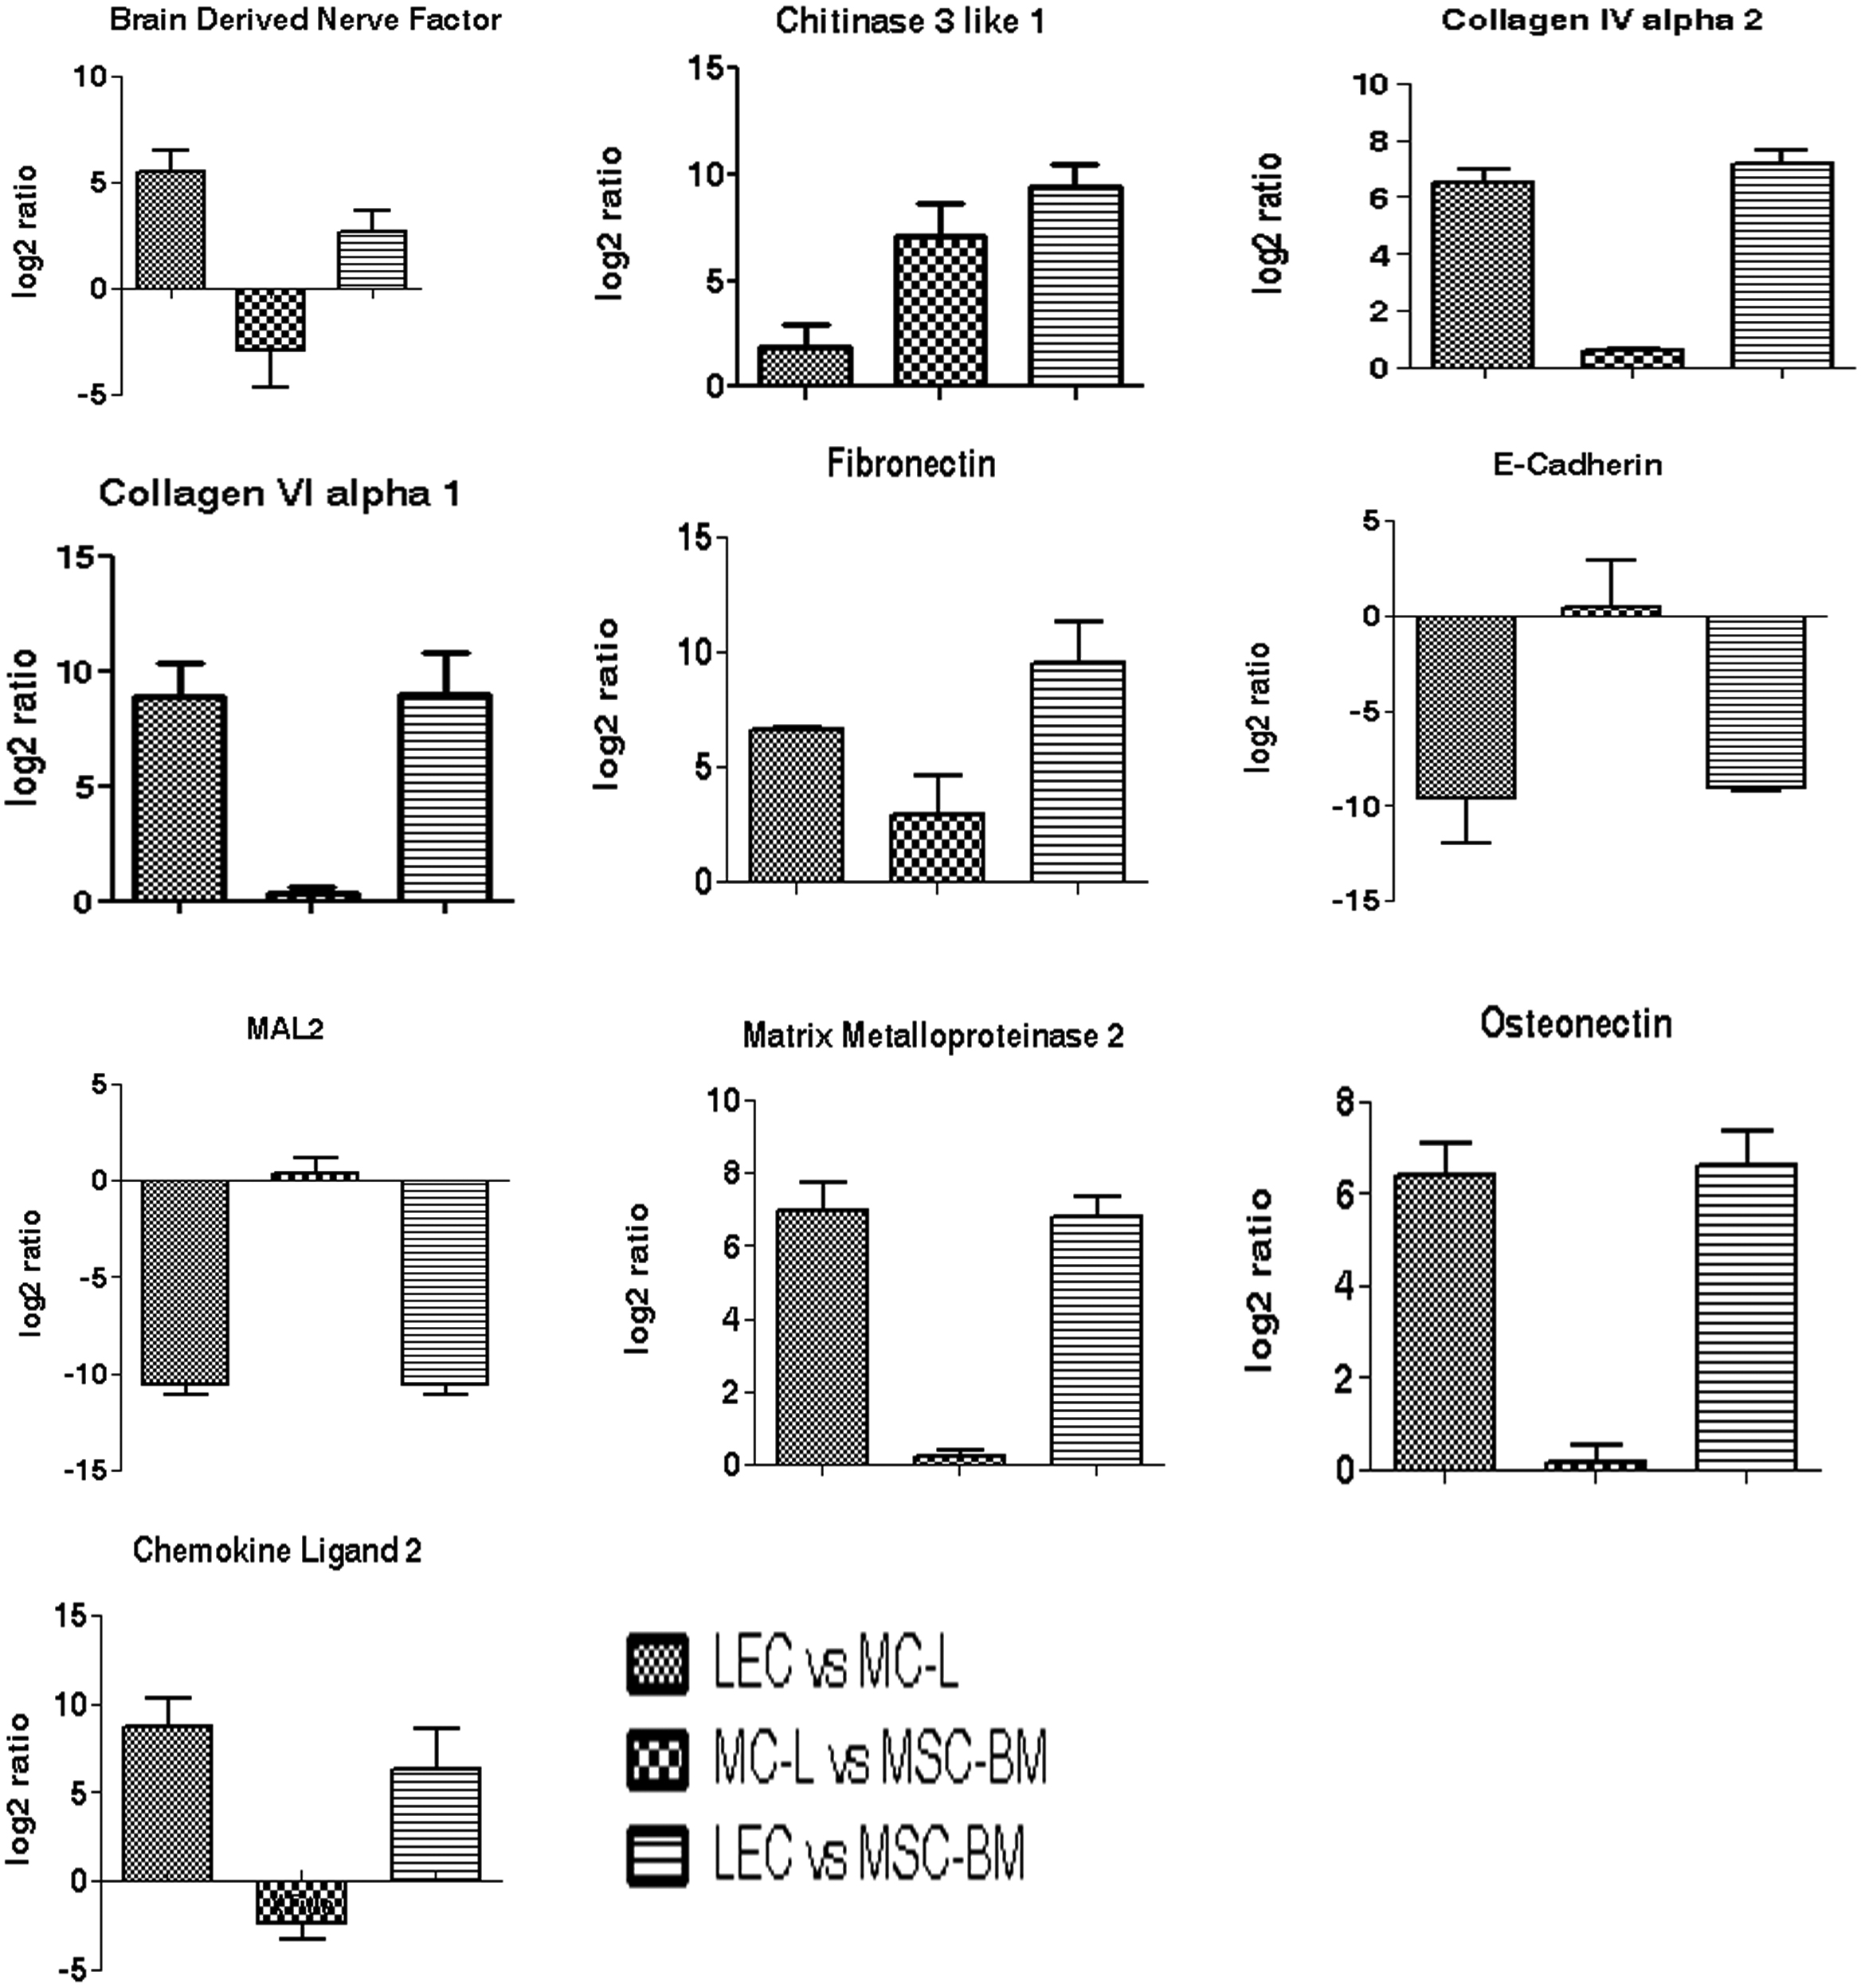
Figure 3.
Validation of microarray data by Real time RT–PCR. The individual gene-specific values thus calculated were averaged to mean±standard deviation and fold change was expressed as log 2 ratios (y-axis).
 Figure 3 of Polisetti, Mol Vis 2010; 16:1227-1240.