Figure 3 of
Zhan, Mol Vis 2010; 16:1154-1161.
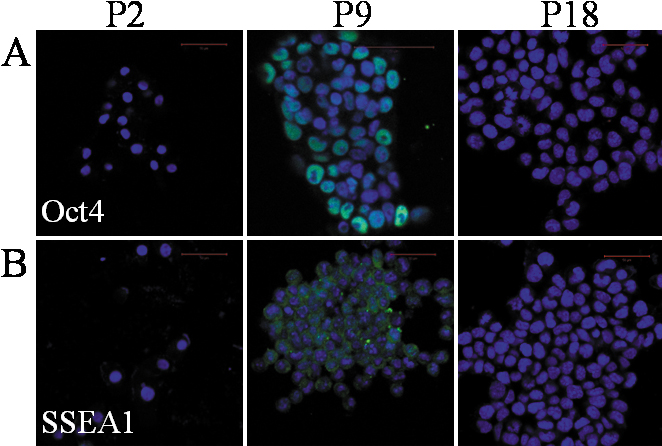
Figure 3.
Expression of pluripotency-associated proteins Oct-4 and SSEA1 in e-Pc with immunofluorescent staining. The scale bar represents 50 μm. Oct-4 and SSEA1 proteins were found in P9 (week 4), not in P18 (week 8) cells.
 Figure 3 of
Zhan, Mol Vis 2010; 16:1154-1161.
Figure 3 of
Zhan, Mol Vis 2010; 16:1154-1161.