Figure 3 of
Cai, Mol Vis 2010; 16:1141-1145.
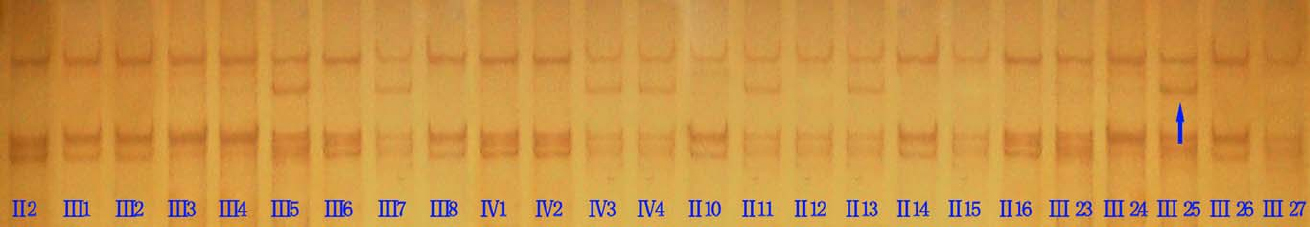
Figure 3.
SSCP analysis of
PAX6
mutation in exon 5. Each affected individual has one more band than normal family members. The arrow indicates the extra band of the index patient (III-25).
 Figure 3 of Cai, Mol Vis 2010; 16:1141-1145.