Figure 5. PPARγ (green) and nuclei (DAPI,
red) staining during meibomian gland morphogenesis. At E18.5 (A)
and P0 (B), PPARγ staining of the epithelial placode was
negative. At P3 (C), PPARγ was first detected in the lumen of
the developing gland and increased progressively as the gland continued
to develop at P5 (D) and P8 (E). At P15 (F), PPARγ
staining was limited to the acini (arrows) or the terminal regions of
the branching ductules (the asterisk shows a well developed central
duct at P15).
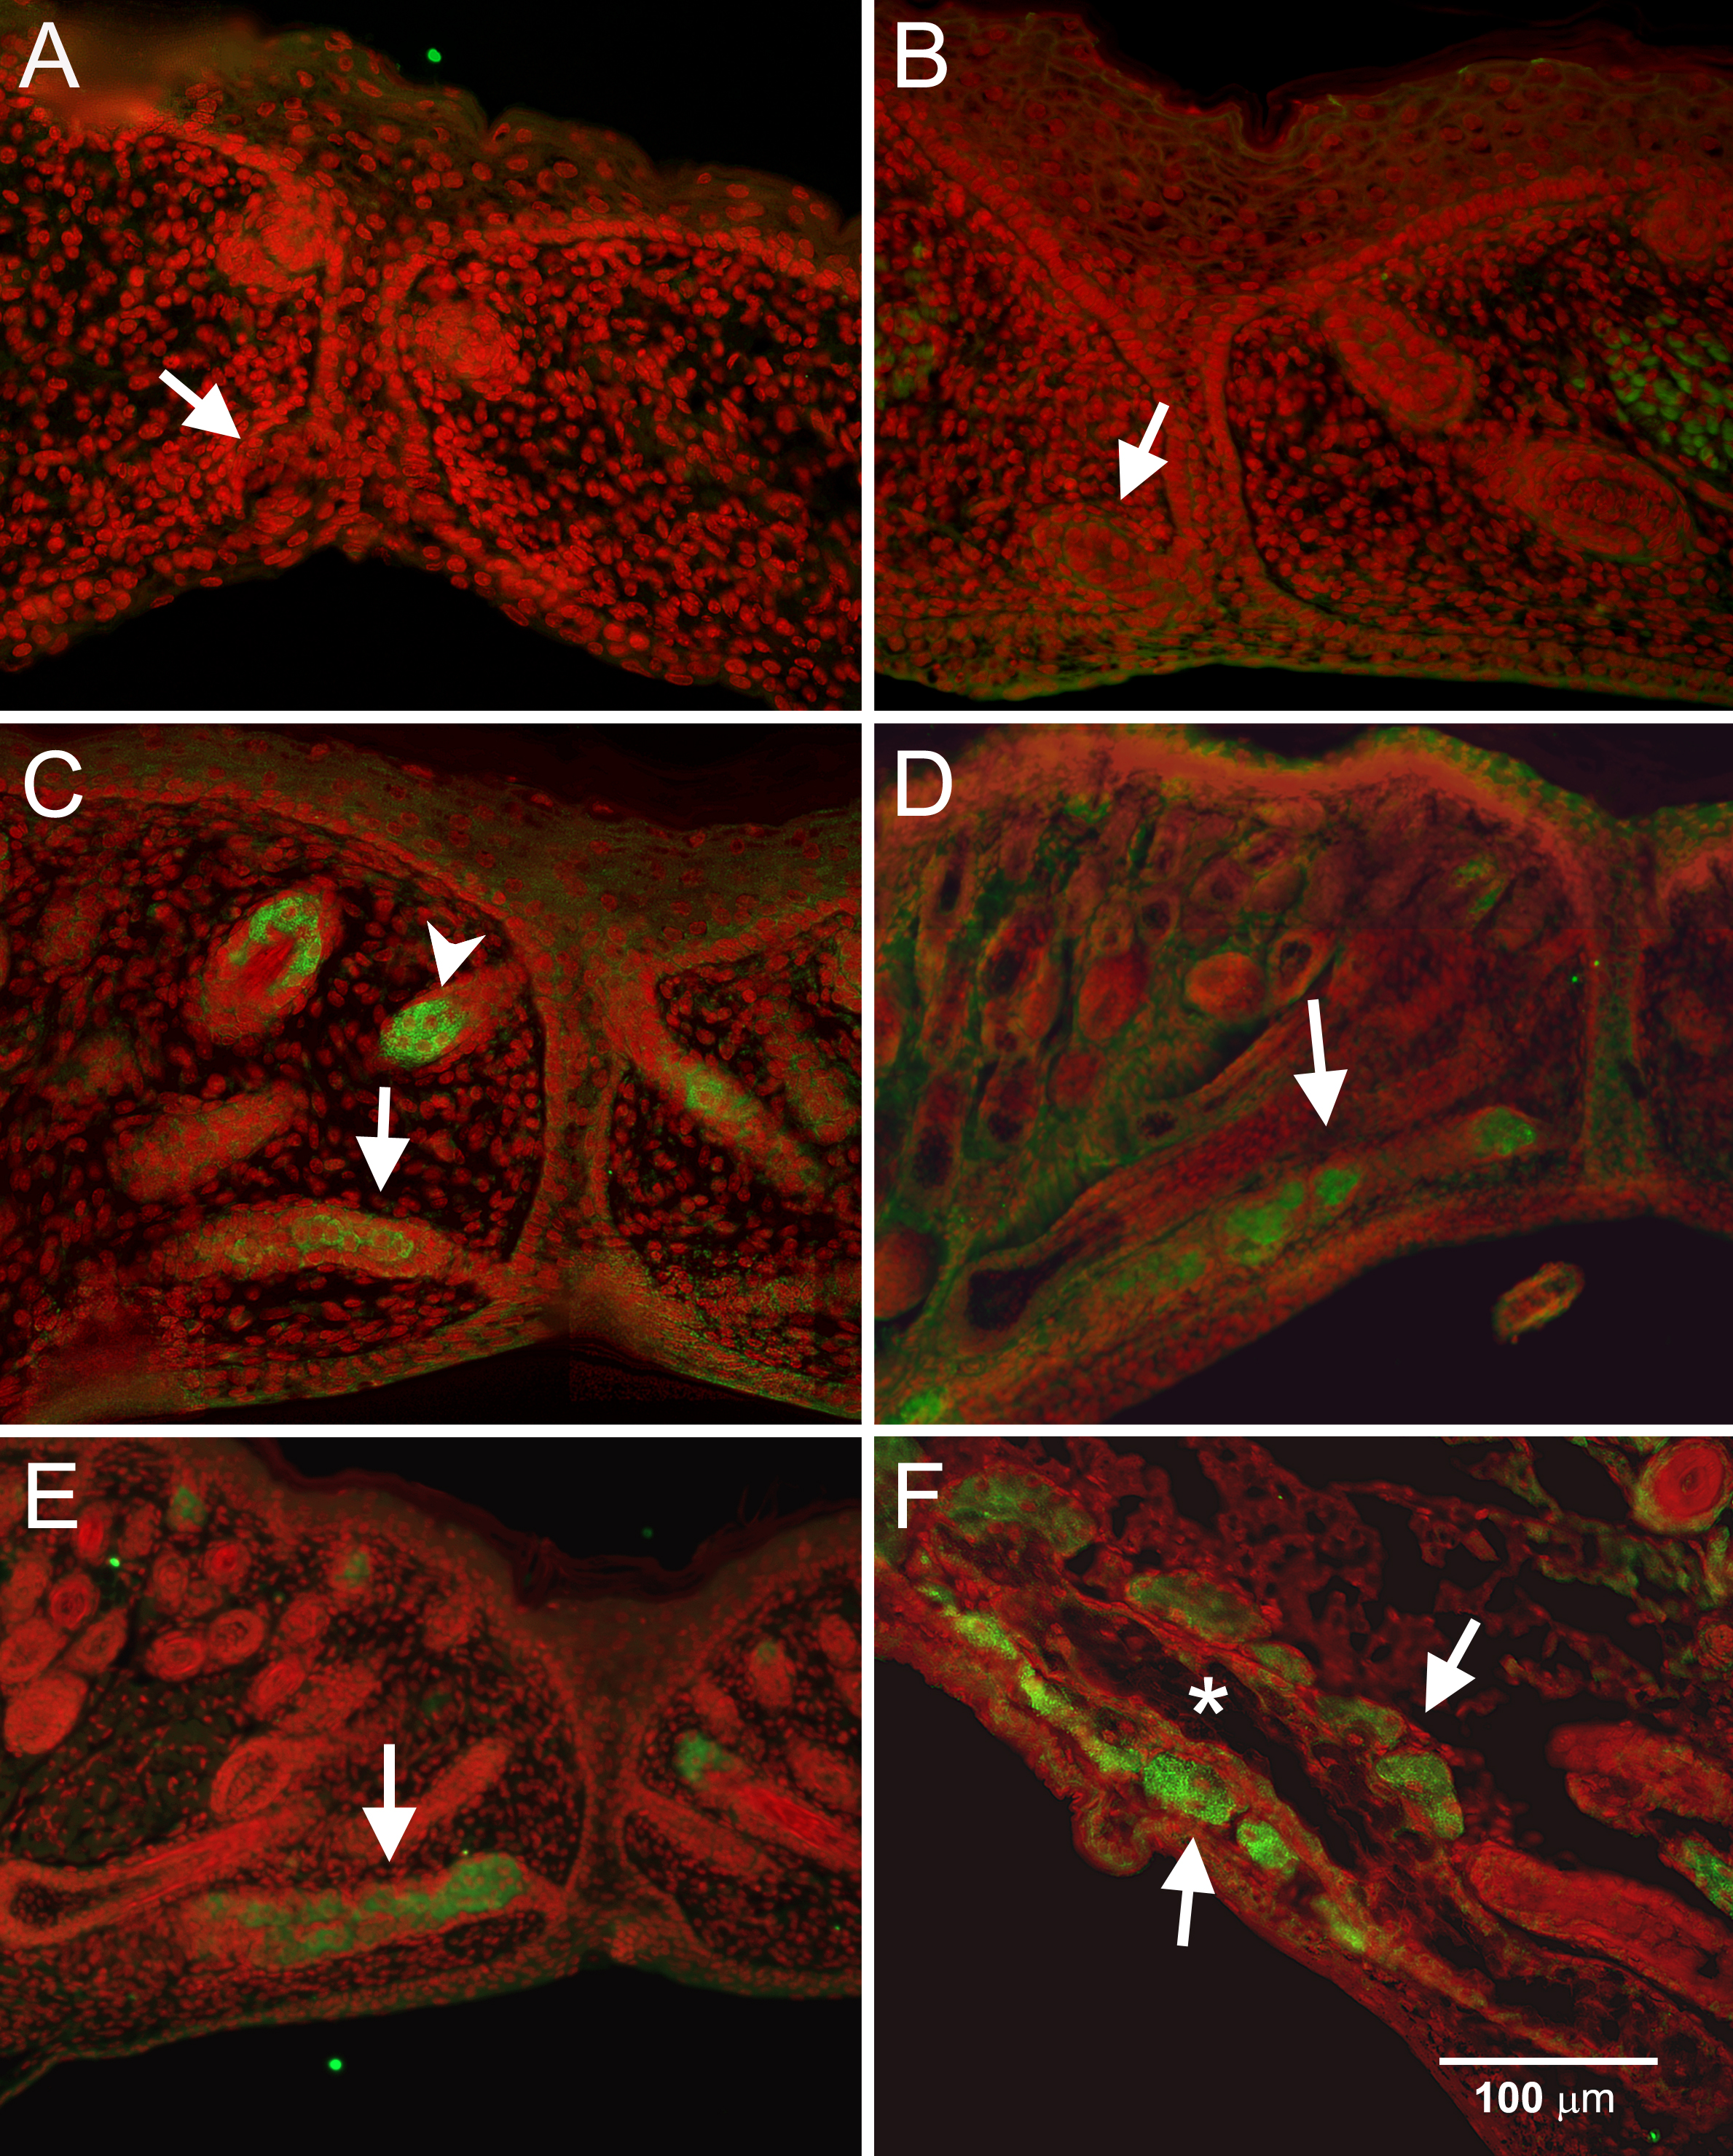
 Figure 5 of Nien, Mol Vis 2010; 16:1132-1140.