Figure 4. Normalized GRP78 protein levels were measured in cells (treated with Tm or STS) using western blot analysis and were shown
relative to levels in no treatment cells. Meanwhile, the expression peak of GRP78 protein appeared at 24 h after treatment
with Tm. After exposure to Tm and following ER stress, increased GRP78 protein levels were detected in all cells, however,
a lower fold change of the protein (2.564 versus 2.710 for 24 h exposure) was found in GTM cells compared to NTM cells (p<0.05).
Error bars represent SDs from three individual experiments, ANOVA test, the double asterisk indicates a p<0.05; Student’s
t-test, and the asterisk indicates a p<0.05.
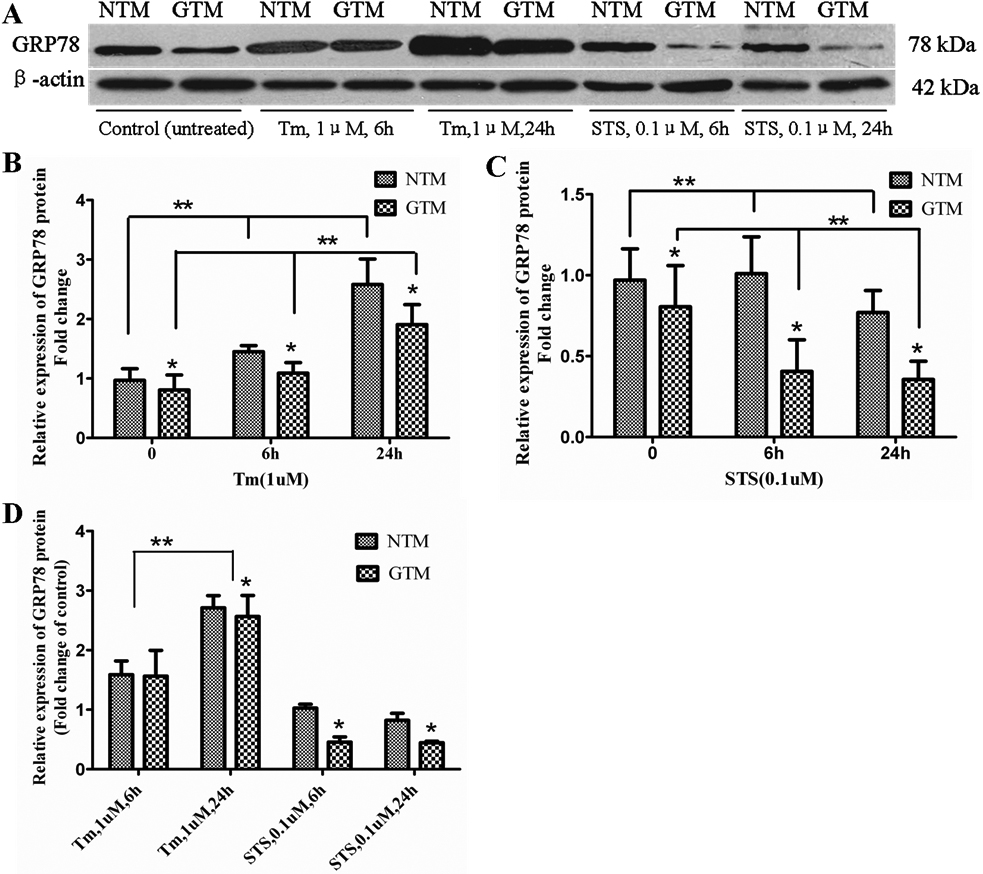
 Figure 4 of
Chai, Mol Vis 2010; 16:1122-1131.
Figure 4 of
Chai, Mol Vis 2010; 16:1122-1131.