Figure 3. Both NTM and GTM cells were treated as indicated, and normalized GRP78 mRNA levels were measured using real time PCR and were shown relative to levels in untreated cells. All experiments were
performed in triplicate, and the relative amount of mRNA in each sample was calculated using the 2-ΔCt method in individual experiments. Values represent the means±SDs, ANOVA test, the double asterisk indicates a p<0.05; Student’s
t-test, and the asterisk indicates a p<0.05.
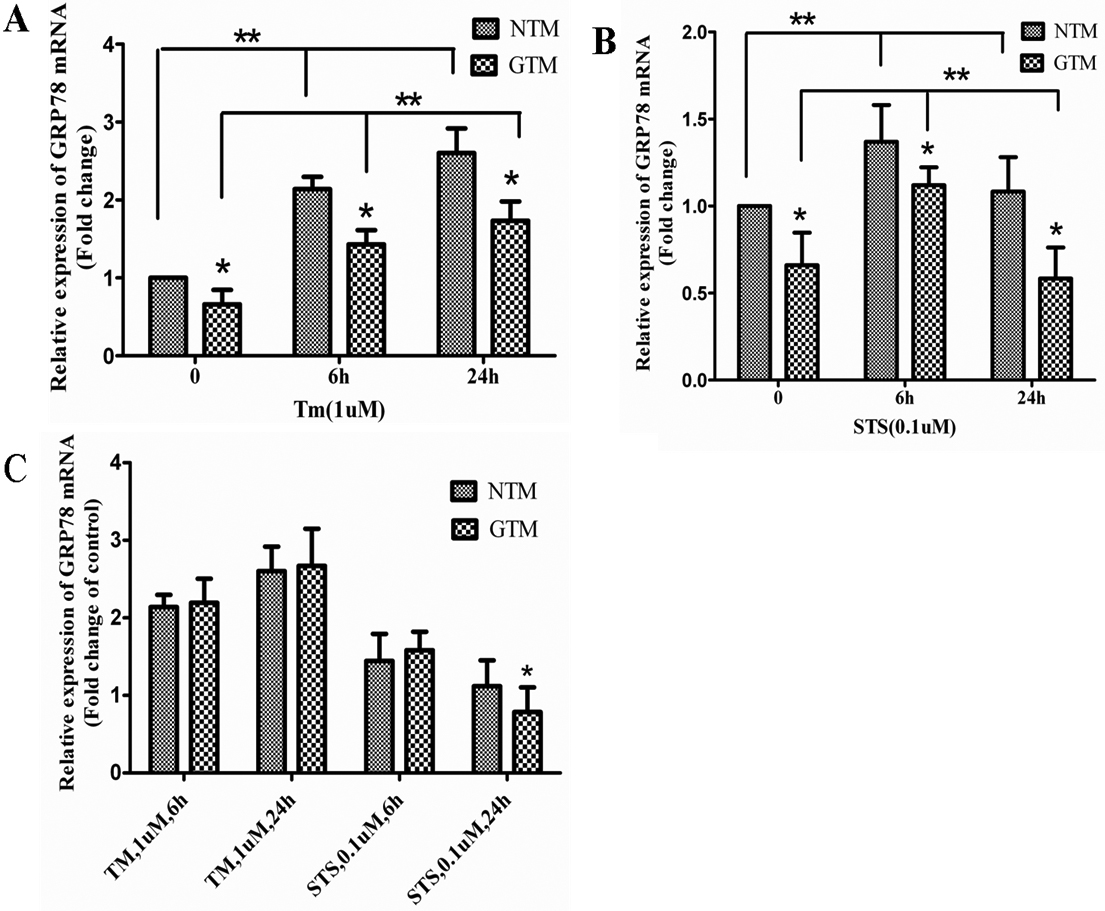
 Figure 3 of
Chai, Mol Vis 2010; 16:1122-1131.
Figure 3 of
Chai, Mol Vis 2010; 16:1122-1131.