Figure 1. Morphology of TM cells before and after Tm or STS treatment. NTM and GTM cells were obtained and cultured using identical
culture protocols. GTM cells were slightly larger compared to NTM cells. The morphology of the cells became thin and slender
after treatment with 1 μM Tm or 0.1 μM STS for 24 h as compared to untreated controls, especially in the STS-treated group.
Gross morphological alterations (cell shrinkage, low density) were apparent at 24 h after STS treatment. Scale bar=30 μm.
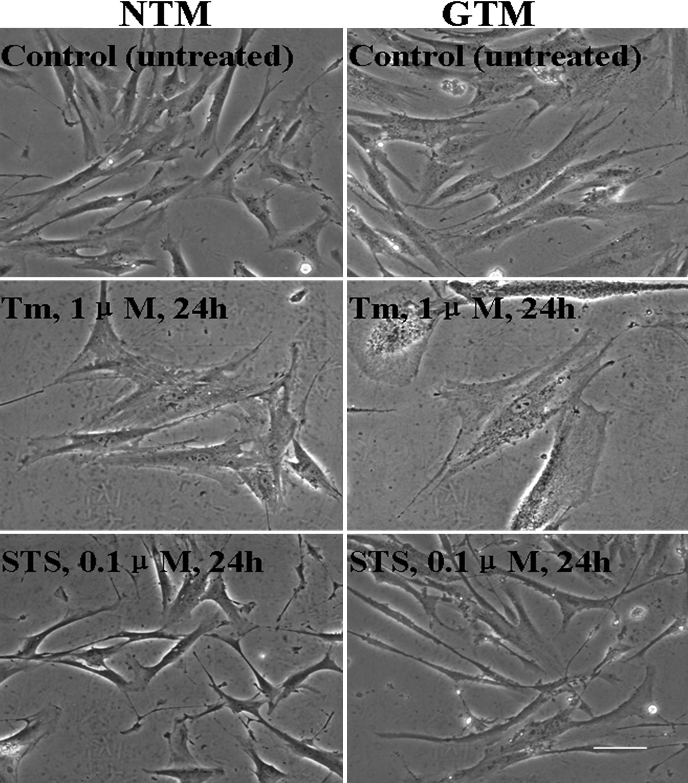
 Figure 1 of
Chai, Mol Vis 2010; 16:1122-1131.
Figure 1 of
Chai, Mol Vis 2010; 16:1122-1131.