Figure 5. Maximum pixel versus nuclear area scatter plot. A laser scanning cytometry scatter plot of the nuclear area versus the maximum
pixel intensity in the blue channel. The polygon defines a gate that separates true nuclei (inside) as opposed to debris and
smaller particulates (outside). The gated nuclei are carried forward in the analysis.
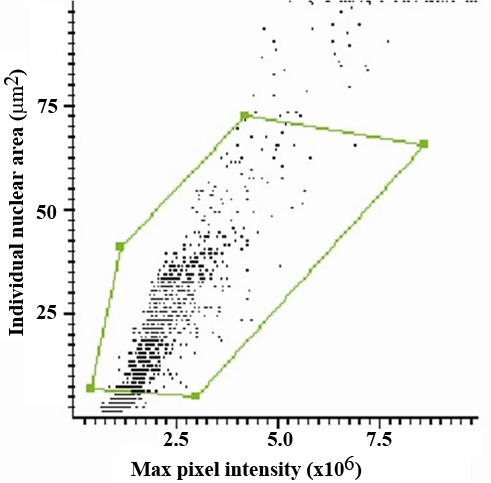
 Figure 5 of
Hjelmeland, Mol Vis 2010; 16:1108-1121.
Figure 5 of
Hjelmeland, Mol Vis 2010; 16:1108-1121.