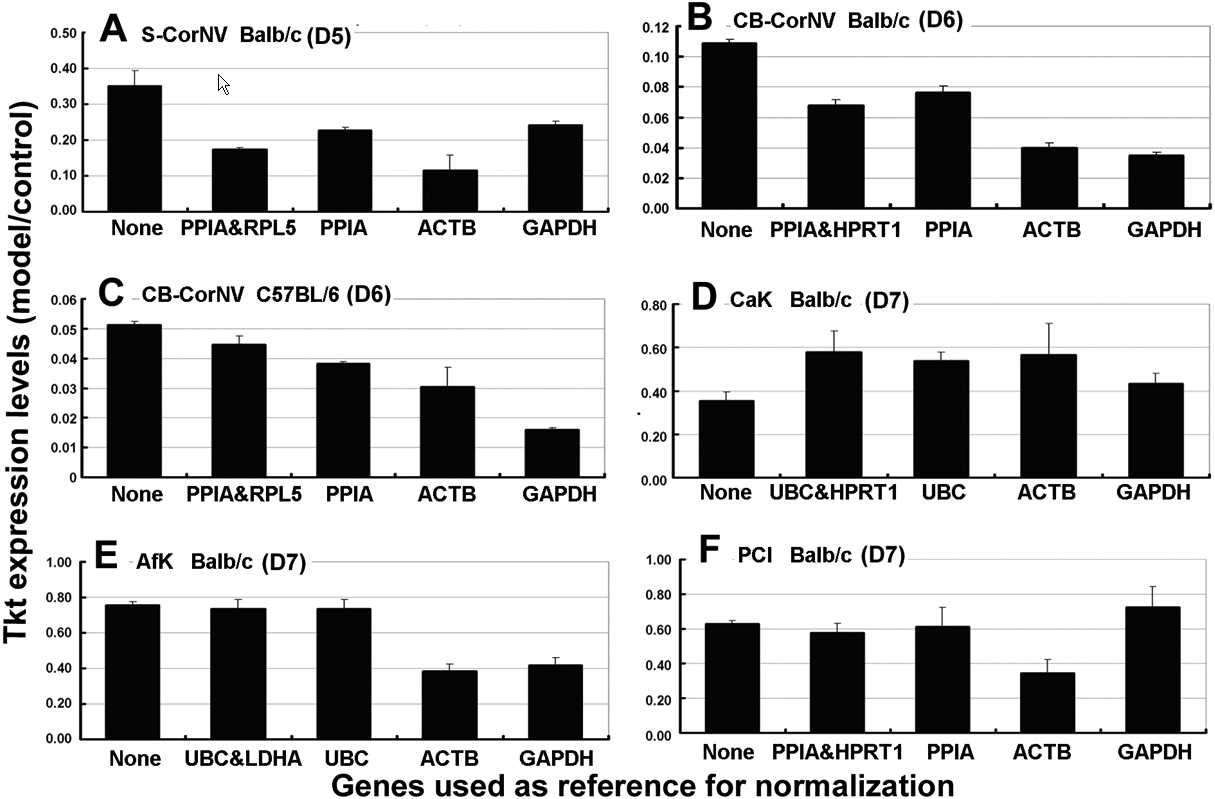
Figure 5. An example of the influence that
choice of HKGs can have on the apparent changes in
Tkt gene
expression levels. Only data from the second time point of each
treatment is shown, but is representative of that disease model, i.e.,
D5 for S-CorNV, D6 for CB-CorNV Balb/c and CB-CorNV C57Bl/6, D7 for
CaK, AfK and PCI. The y-axis is for ratio of the
Tkt expression
levels in disease model corneas to that in control corneas that were
obtained via direct comparison of non-normalized C
t (
none)
or
C
t normalized using each optimal HKG or HKG pair proposed
by
geNorm or
NormFinder,
plus
ACTB and
GAPDH. Please note that the optimal HKGs
or HKG pairs were different among models as shown in
Table 4.
When a HKG pair was used, the geometric means of relative expression
levels against each HKG was used.
 Figure 5 of Ren, Mol Vis 2010; 16:1076-1086.