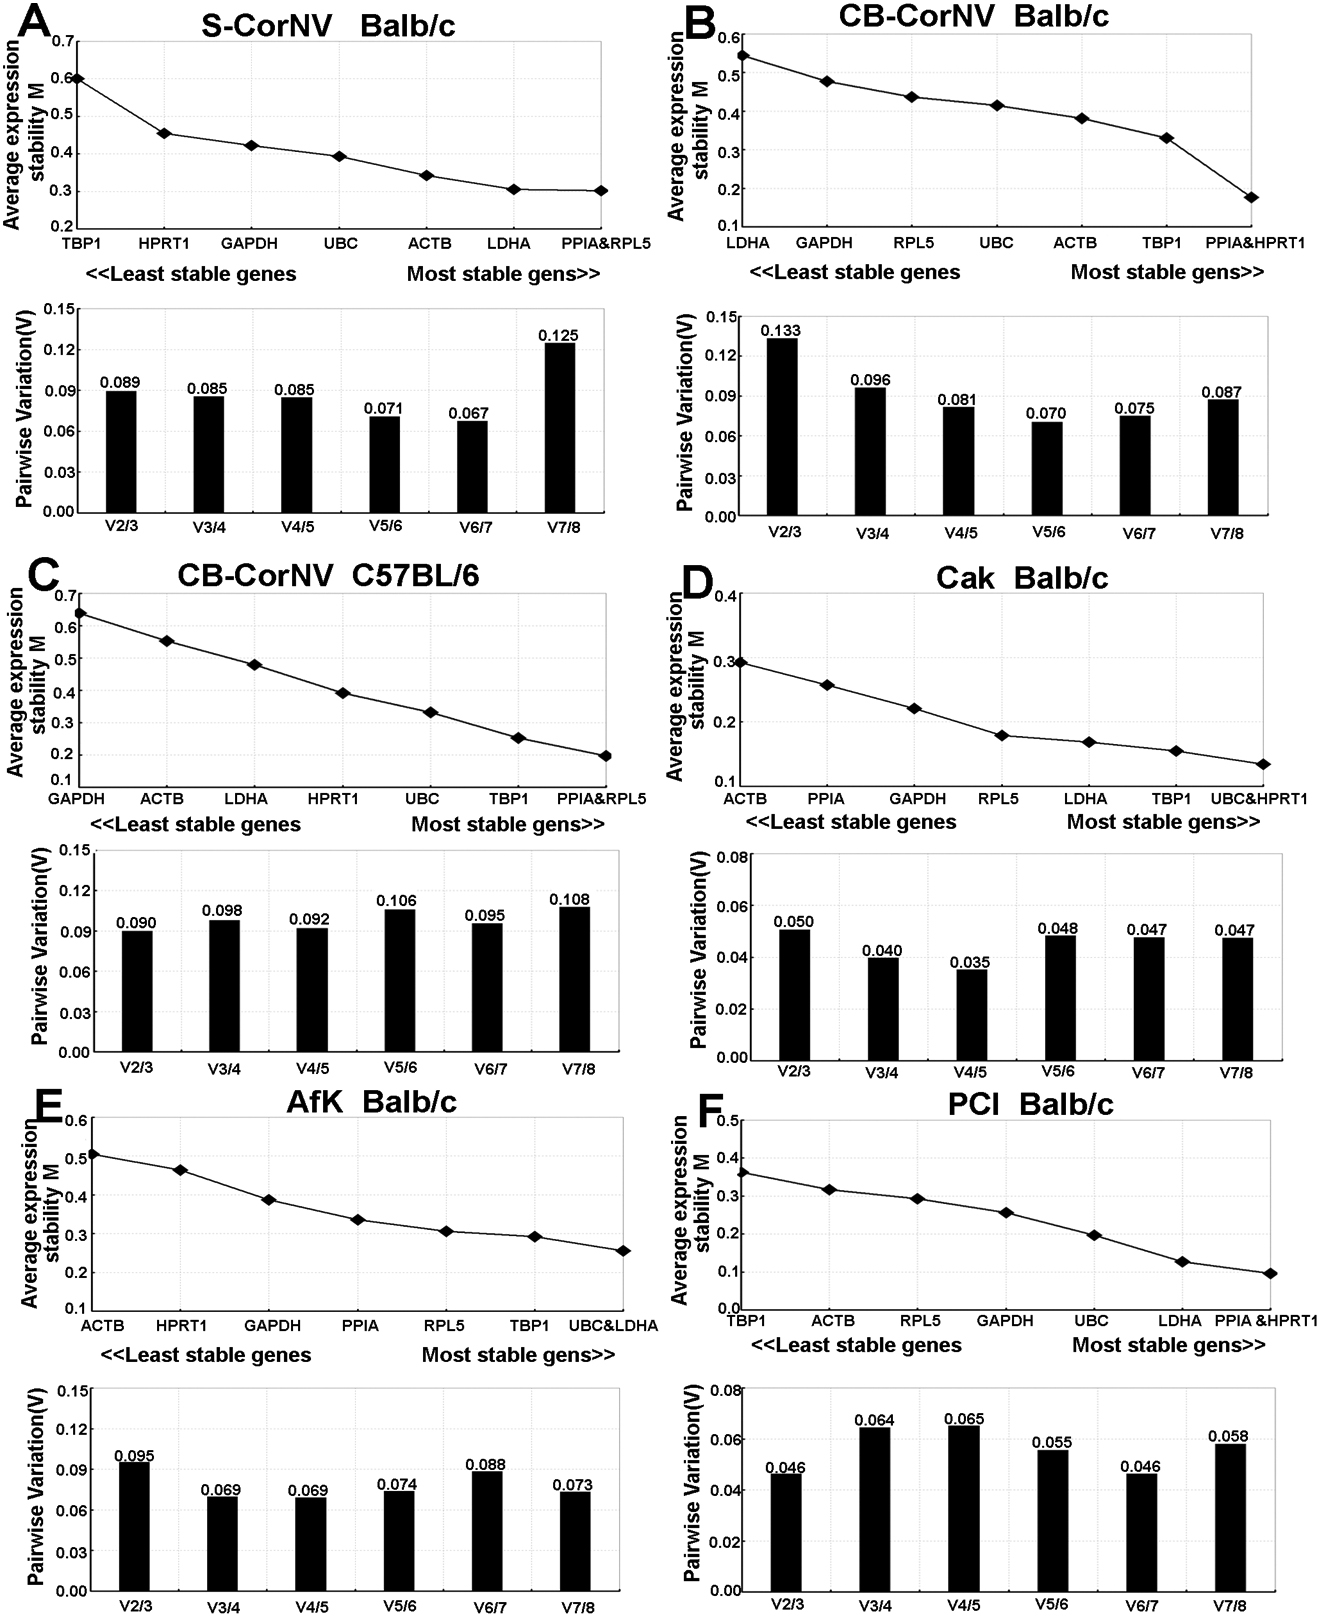
Figure 4. Average expression level
stability (M) and pairwise variation (V) of 8 HKGs as assessed by
geNorm analysis.
The genes with the lower M values are considered to have more stable
expression levels. Pairwise variation was used to determine the optimal
number of HKGs required for normalization. According to the algorithm
and instructions provided with the software, a cutoff of 0.15 for V was
used. It was apparent from analysis of all studied models that a
combination of two HKGs is sufficient for normalization.
 Figure 4 of Ren, Mol Vis 2010; 16:1076-1086.