Figure 3 of
Ren, Mol Vis 2010; 16:1076-1086.
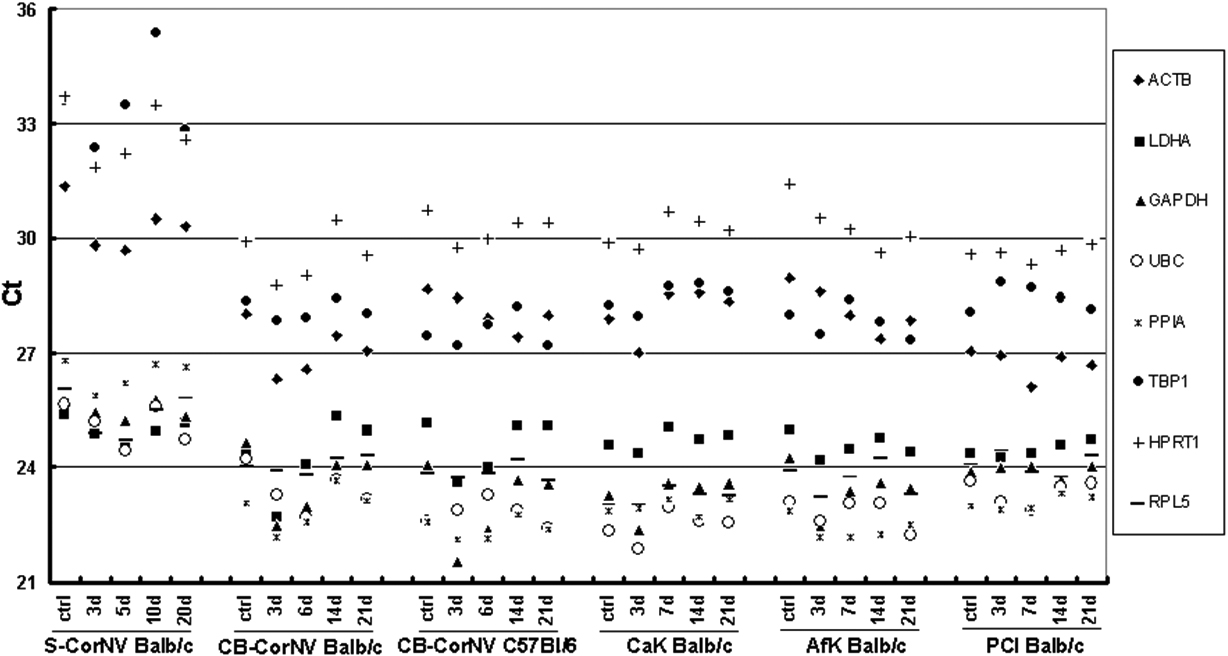
Figure 3.
Raw C
t
data for 8 candidate HKGs in each corneal disease model obtained using qRT–PCR. It should be noted that each point represents the mean of reactions performed in triplicate for each cDNA sample and for each gene.
 Figure 3 of
Ren, Mol Vis 2010; 16:1076-1086.
Figure 3 of
Ren, Mol Vis 2010; 16:1076-1086.