Figure 2. Changes in expression of the 8 HKGs in murine corneas with experimental CorNV as assessed by microarray. The ratios were obtained
by comparing the normalized fluorescence intensity of experimental corneas to that of the controls. In this commercial microarray,
ACTB, LDHA, GAPDH, and RPL5 are used as HKGs, thus each is represented by 50 spots in the array. The average of these 50 signals was used to calculate
the average and standard error for each group and this was used for comparison with the other four genes (viz. UBC, PPIA, TBP1, and HPRT1, which are represented by only one spot in the array). The data presented (mean±standard deviation) were obtained from three
(for S-CorNV Balb/c D5 and CB-CorNV Balb/c D6 groups) or two (for the other three groups) arrays. The coefficient of variation
(CV) was obtained by dividing the standard deviation by the mean in each model. S-CorNV Balb/c D5: suture-induced CorNV in
Balb/c mice, day 5; S-CorNV Balb/c D10: suture-induced CorNV in Balb/c mice, day 10; CB-CorNV Balb/c D6: chemical burn-induced
CorNV in Balb/c mice, day 6; CB-CorNV Balb/c D14: chemical burn-induced CorNV in Balb/c mice, day 14; CB-CorNV C57Bl/6 D6:
chemical burn-induced CorNV in C57Bl/6 mice, day 6.
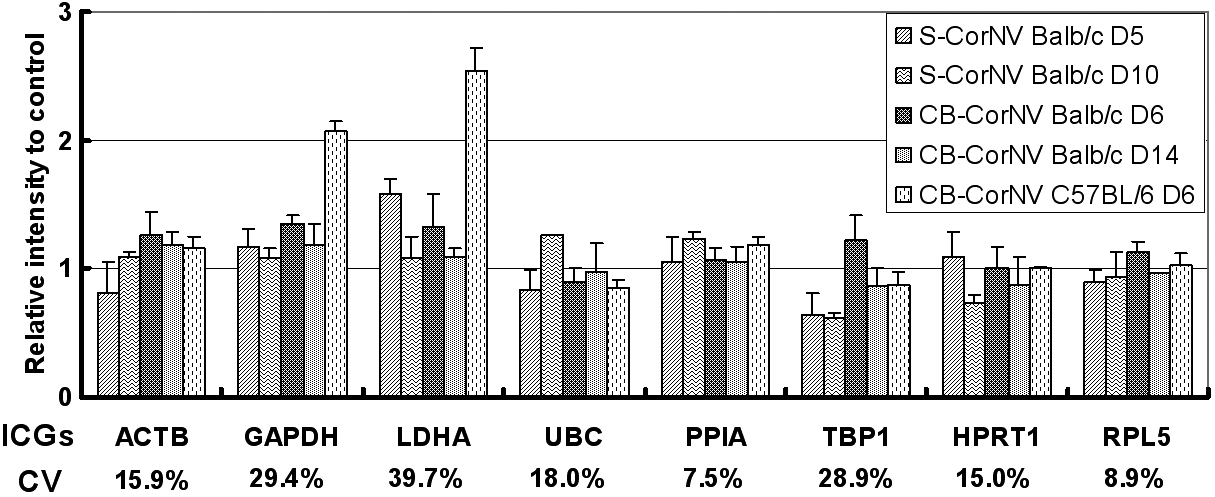
 Figure 2 of
Ren, Mol Vis 2010; 16:1076-1086.
Figure 2 of
Ren, Mol Vis 2010; 16:1076-1086.