Figure 1. 2-DE gels showing the proteome maps of total proteins from the lenses. 882 μg of samples were loaded. Pre-cast gels of 12
% were used for the second dimension, and were stained with colloid Coomassie brilliant blue (CBB) R-250. Low-abundance proteins
were shown in the rectangle box. A: Cataract mice. BFSP/filensin spots were absent. B: Normal mice. BFSP/filensin spots were highly detectable in normal samples.
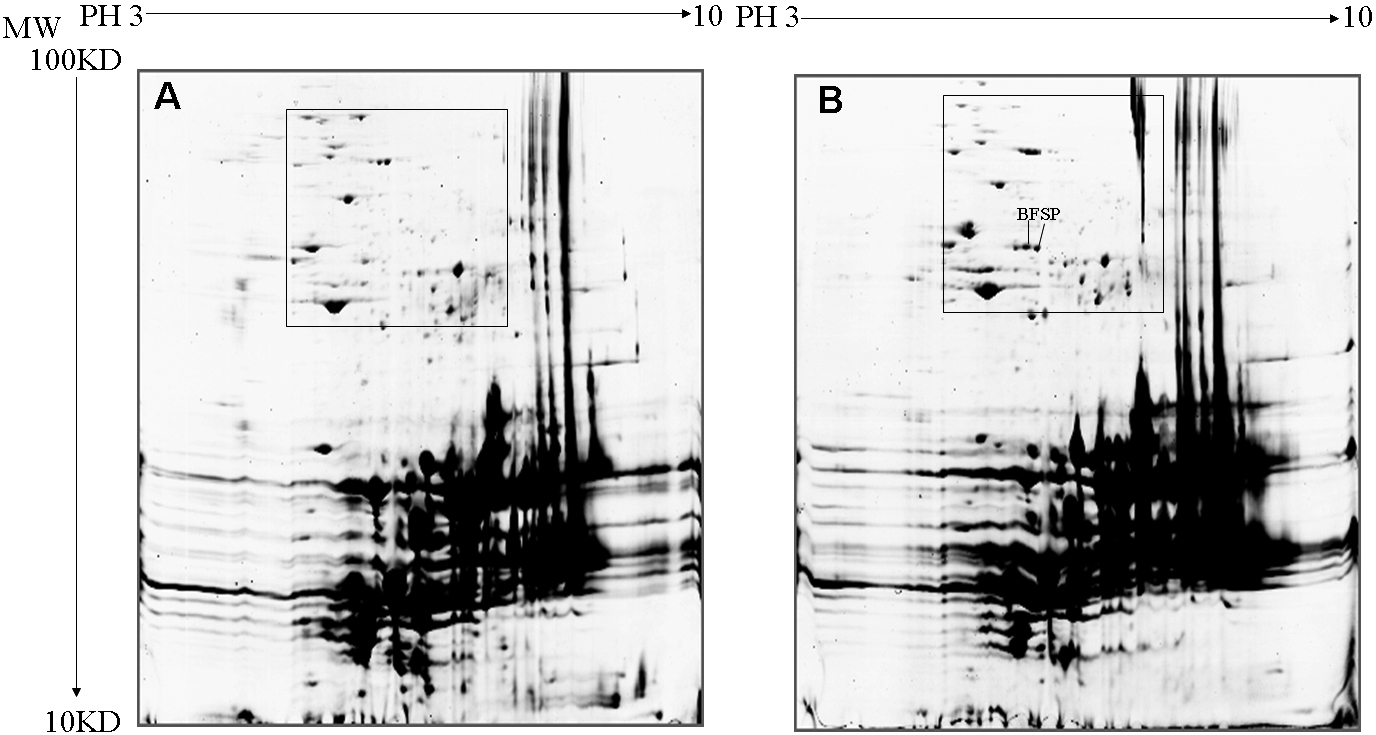
 Figure 1 of
Ji, Mol Vis 2010; 16:1068-1075.
Figure 1 of
Ji, Mol Vis 2010; 16:1068-1075.