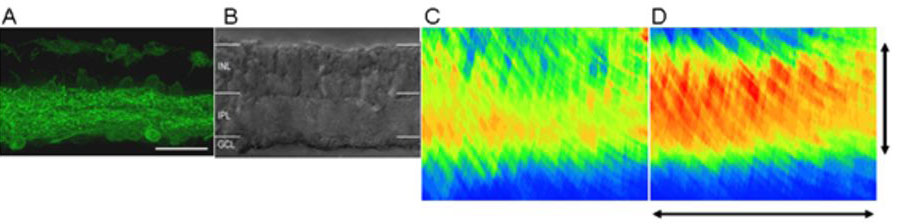
Figure 4. Vertical analysis of the retina.
A: Numerous green fluorescent protein (GFP)-positive ganglion, amacrine, and horizontal cells can be seen in the cryostat section
of a retina after a light-exposed magnetic resonance imaging experiment.
B: Nomarski image of the same region shown in (
A) reveals the absence of photoreceptors. Abbreviations are as follows: INL represents inner nuclear layer; IPL represents
inner plexiform layer; GCL represents ganglion cell layer. The scale bar is equal to 25 μm in
A and
B.
C-D: Pseudocolor linearized average 1/T1 maps of the central retina from uninjected (
C) and virus injected (
D) eyes, scaled vertically to approximately match the boundaries of (
A) and (
B). The pseudocolor scale was
blue to
green to
yellow to
red, which represents lowest (0.56 s
−1) to highest (2.25 s
−1) 1/T
1 values. 1/T
1 is directly proportional to manganese concentration [
16]. The vertical scale bar is equal to 130 μm, and the horizontal scale bar is 0.6 mm and applies to
C and
D.
 Figure 4 of
Ivanova, Mol Vis 2010; 16:1059-1067.
Figure 4 of
Ivanova, Mol Vis 2010; 16:1059-1067.