Figure 3. Optic nerve analysis in light
and dark conditions. A: Region-of-interest on optic nerve of
light-exposed ChR2-infected eye is shown in the white box. Optic nerve
signal intensities were measured in the combined control groups (i.e.,
from noninjected and saline-injected animals; (B) and in the
virus-injected mice (C). The numbers of animals used to generate
these data are listed above each group. Error bars represent the
standard error of the mean. *, p<0.05 was considered significant for
the comparison between light-exposed Chop2-GFP eyes and combined
control groups as well as that of the combined control groups and
dark-exposed Chop2-GFP .
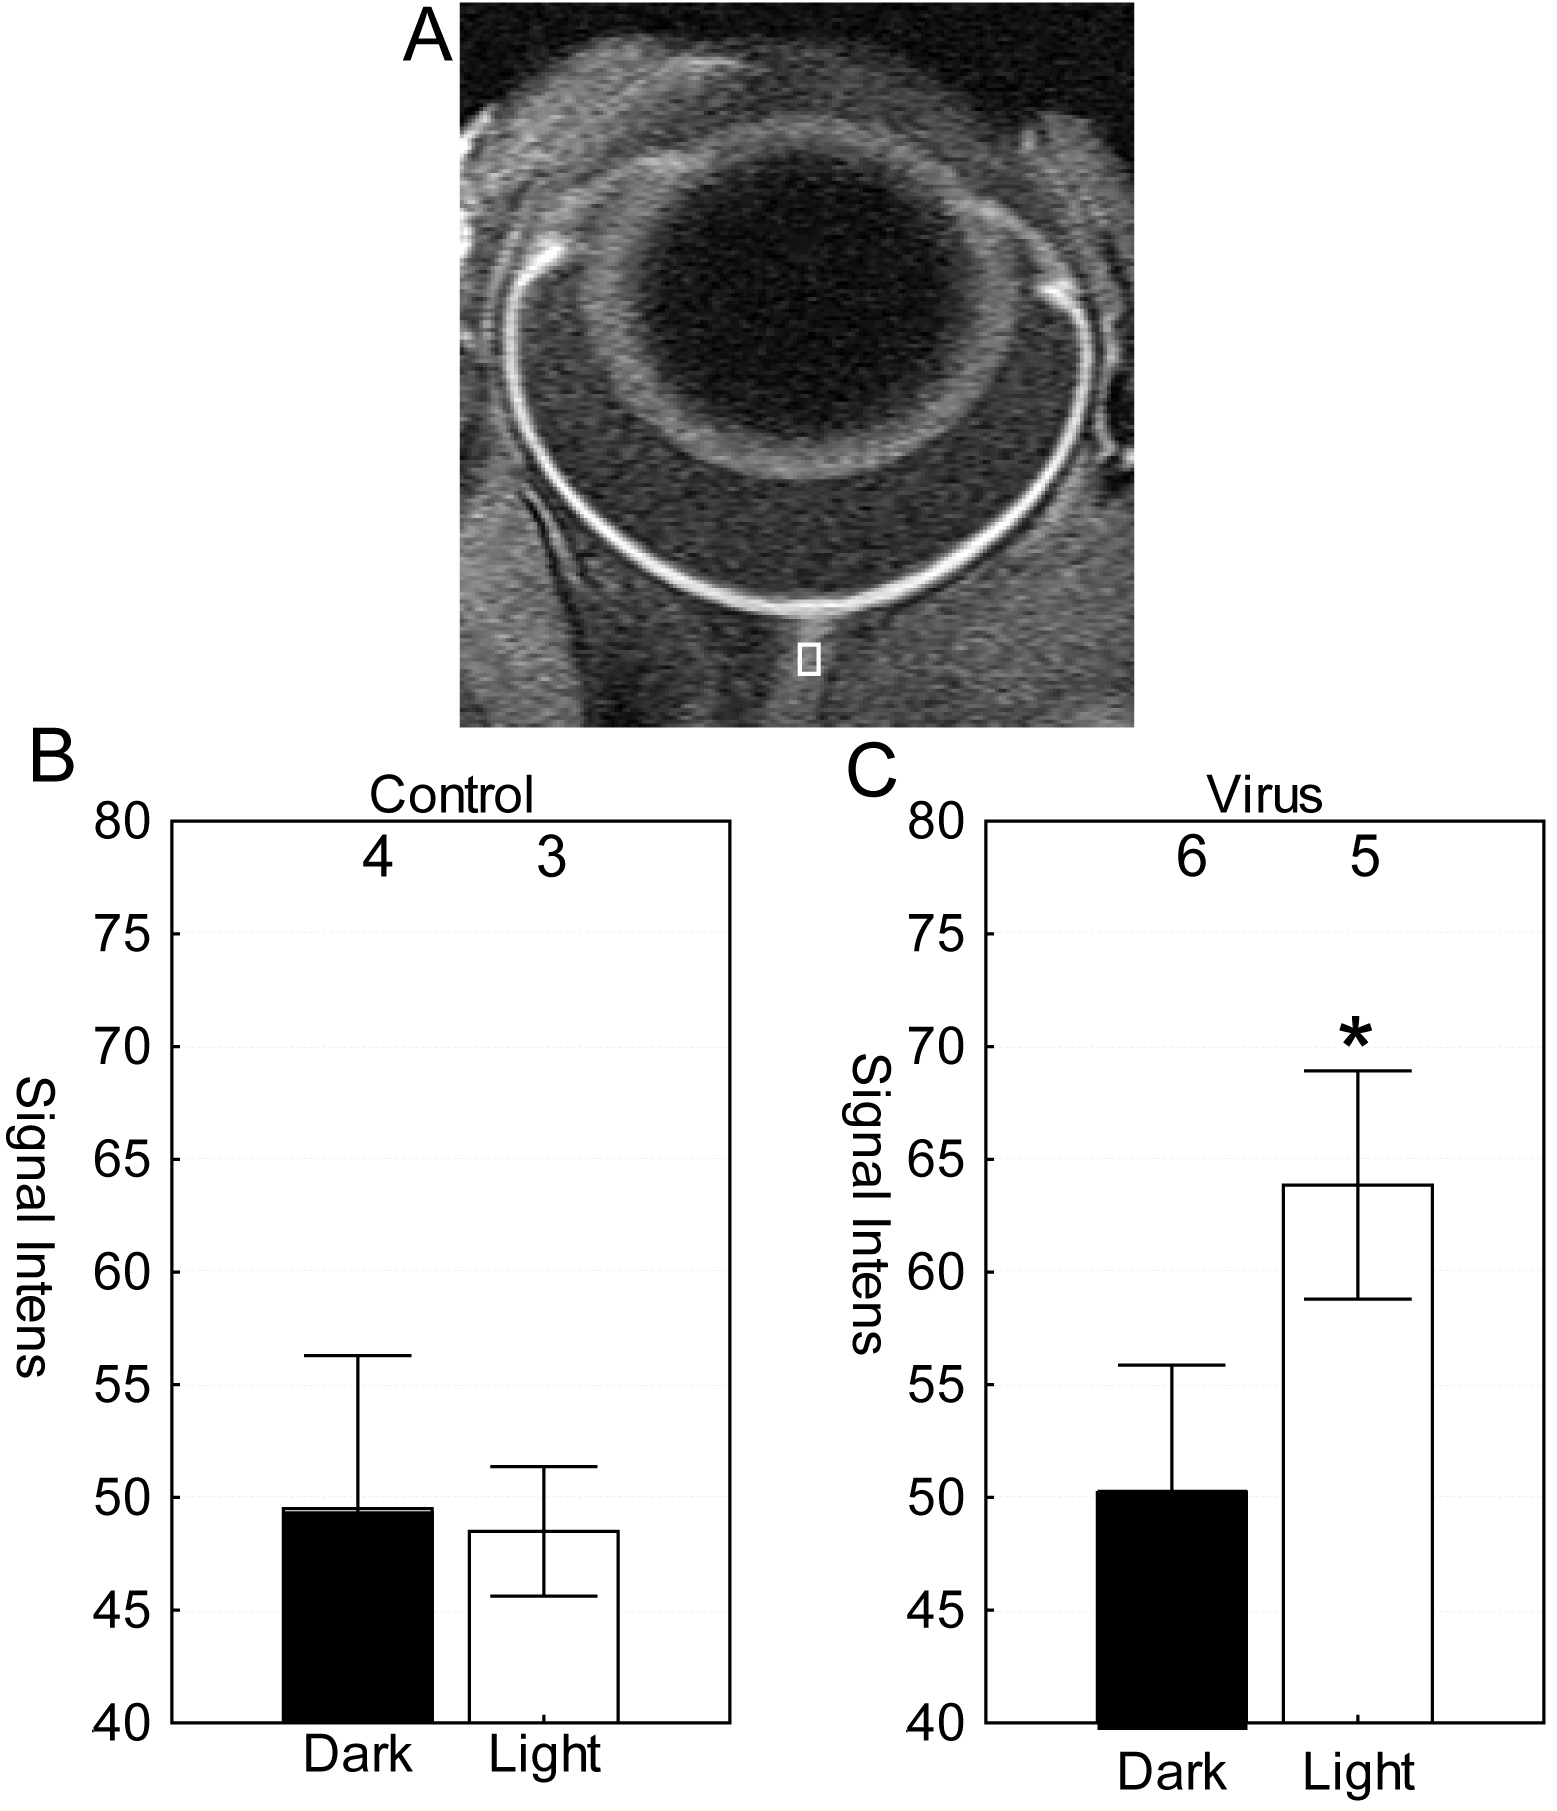
 Figure 3 of Ivanova, Mol Vis 2010; 16:1059-1067.