Figure 1. Illustration of the image
analysis process. The histological section was photographed at high
magnification (A). The pixels corresponding to the lens were
then extracted (B) in Photoshop. Finally, the locations of the
lens edge pixels were determined using an edge-finding algorithm in
MATLAB (C). Overlaid lines in (C) indicate the locations
of the optical axis (vertical line) and equator (horizontal line).
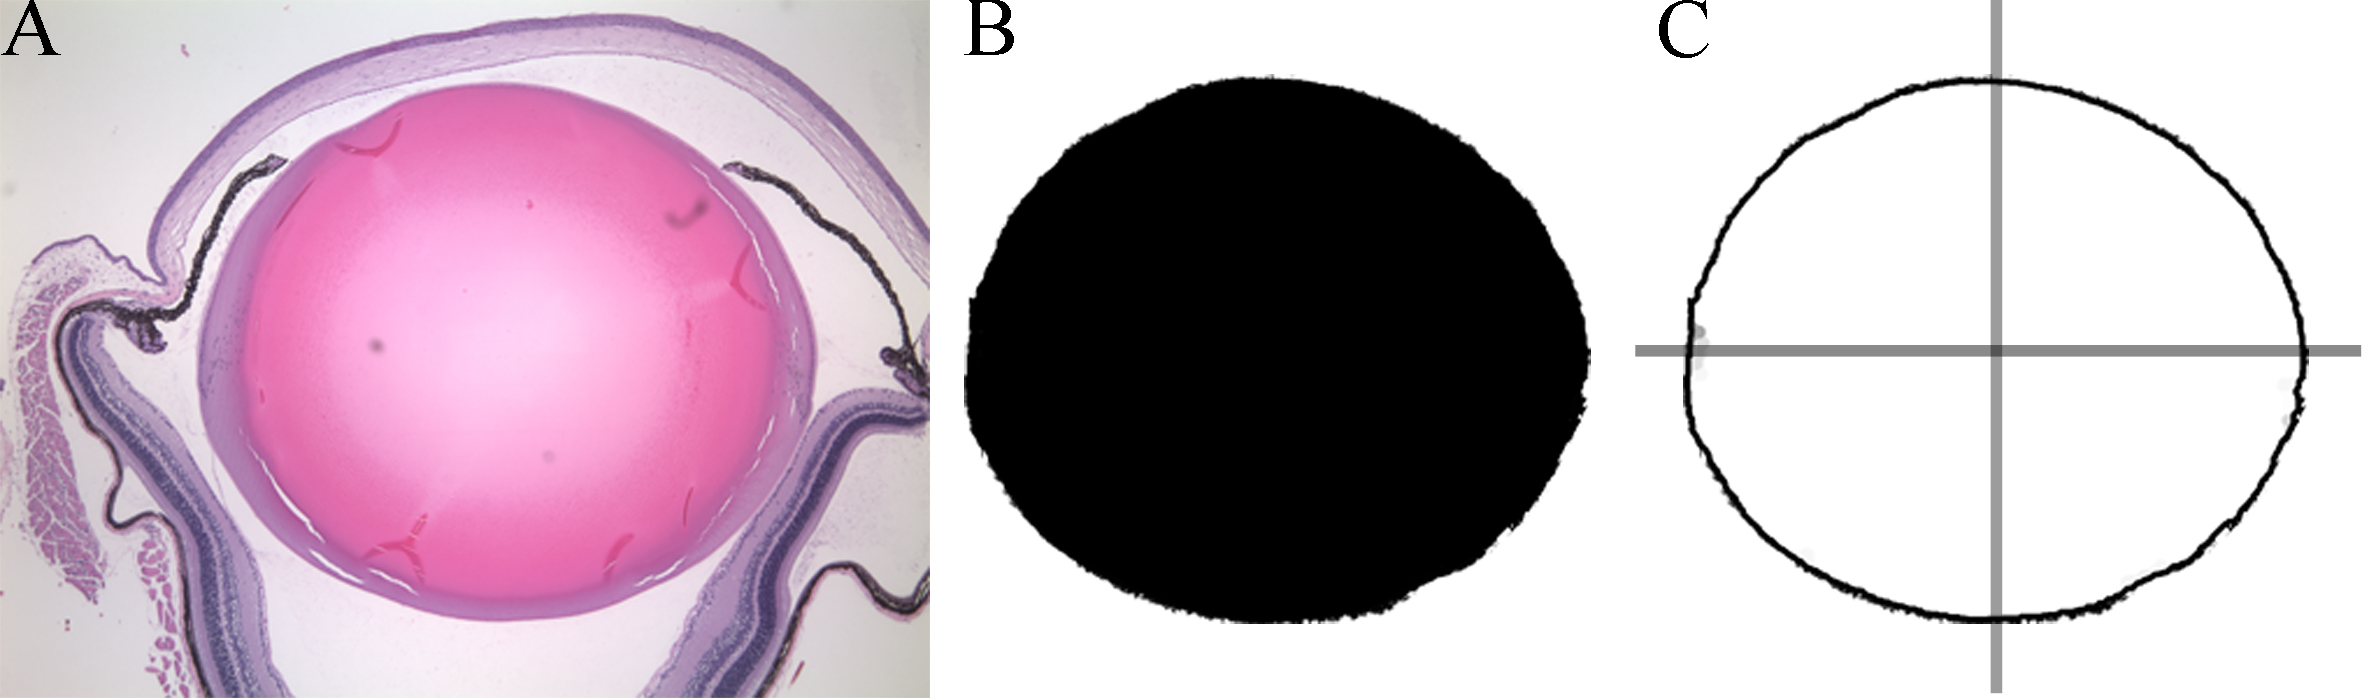
 Figure 1 of Reilly, Mol Vis 2010; 16:1041-1046.