Figure 3 of
Ogando, Mol Vis 2010; 16:1004-1018.
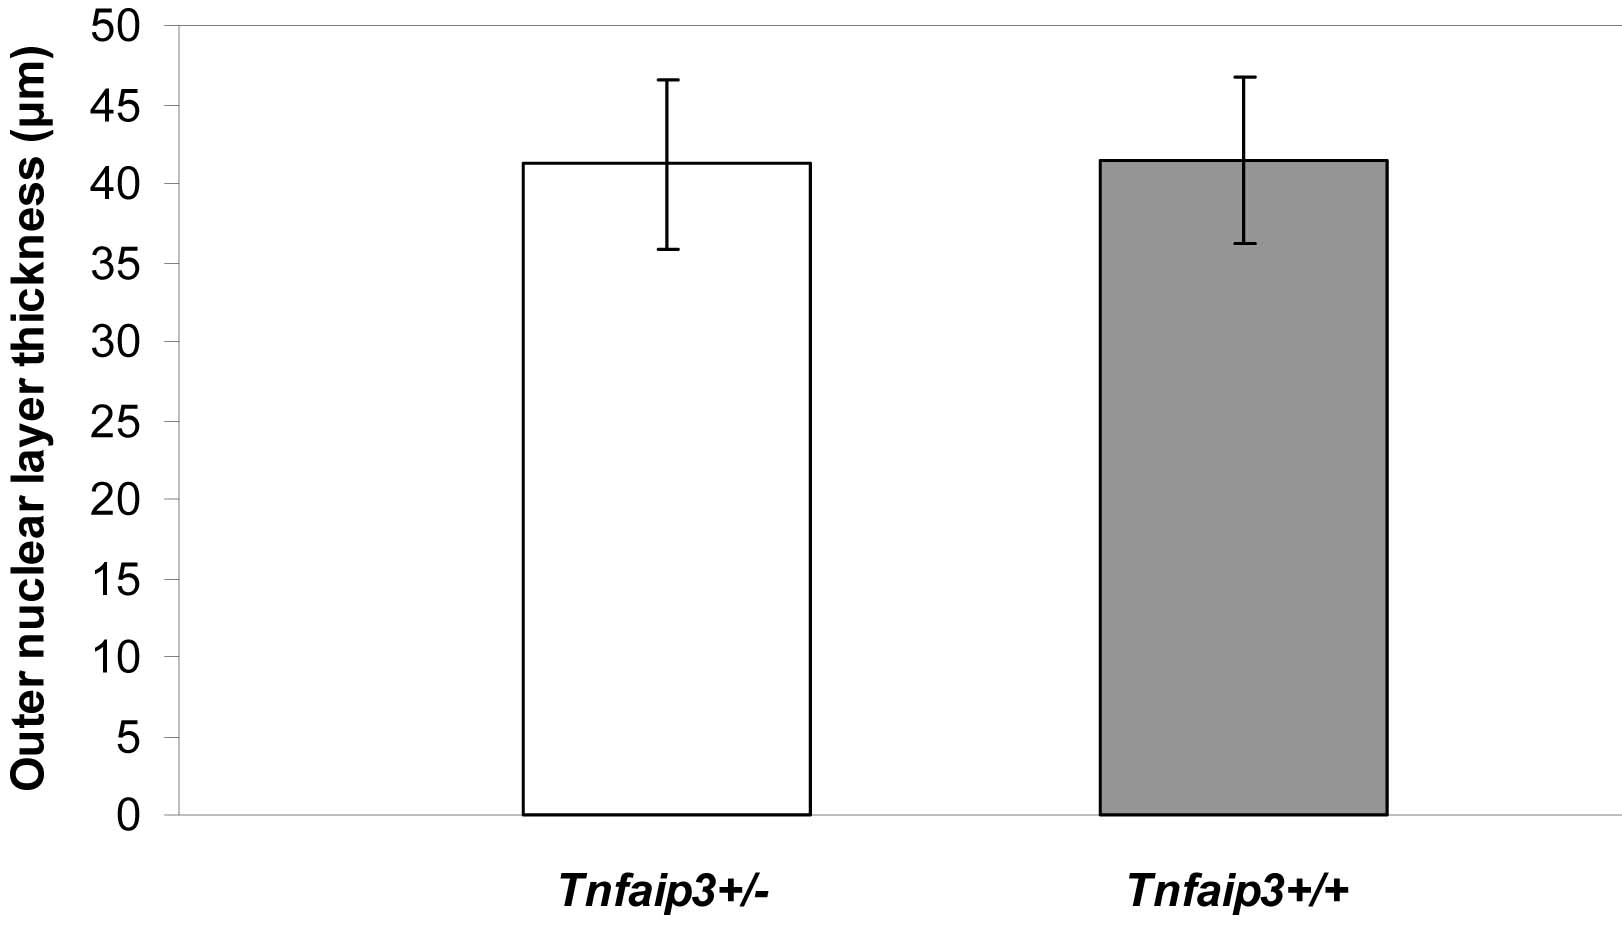
Figure 3.
Phenotype of
Tnfaip3
+/−
mice on a B6 background (N8–10). Outer nuclear layer thickness was compared between
Tnfaip3
+/−
(n=12) and Tnfaip3
+/+
mice (n=13).
 Figure 3 of Ogando, Mol Vis 2010; 16:1004-1018.