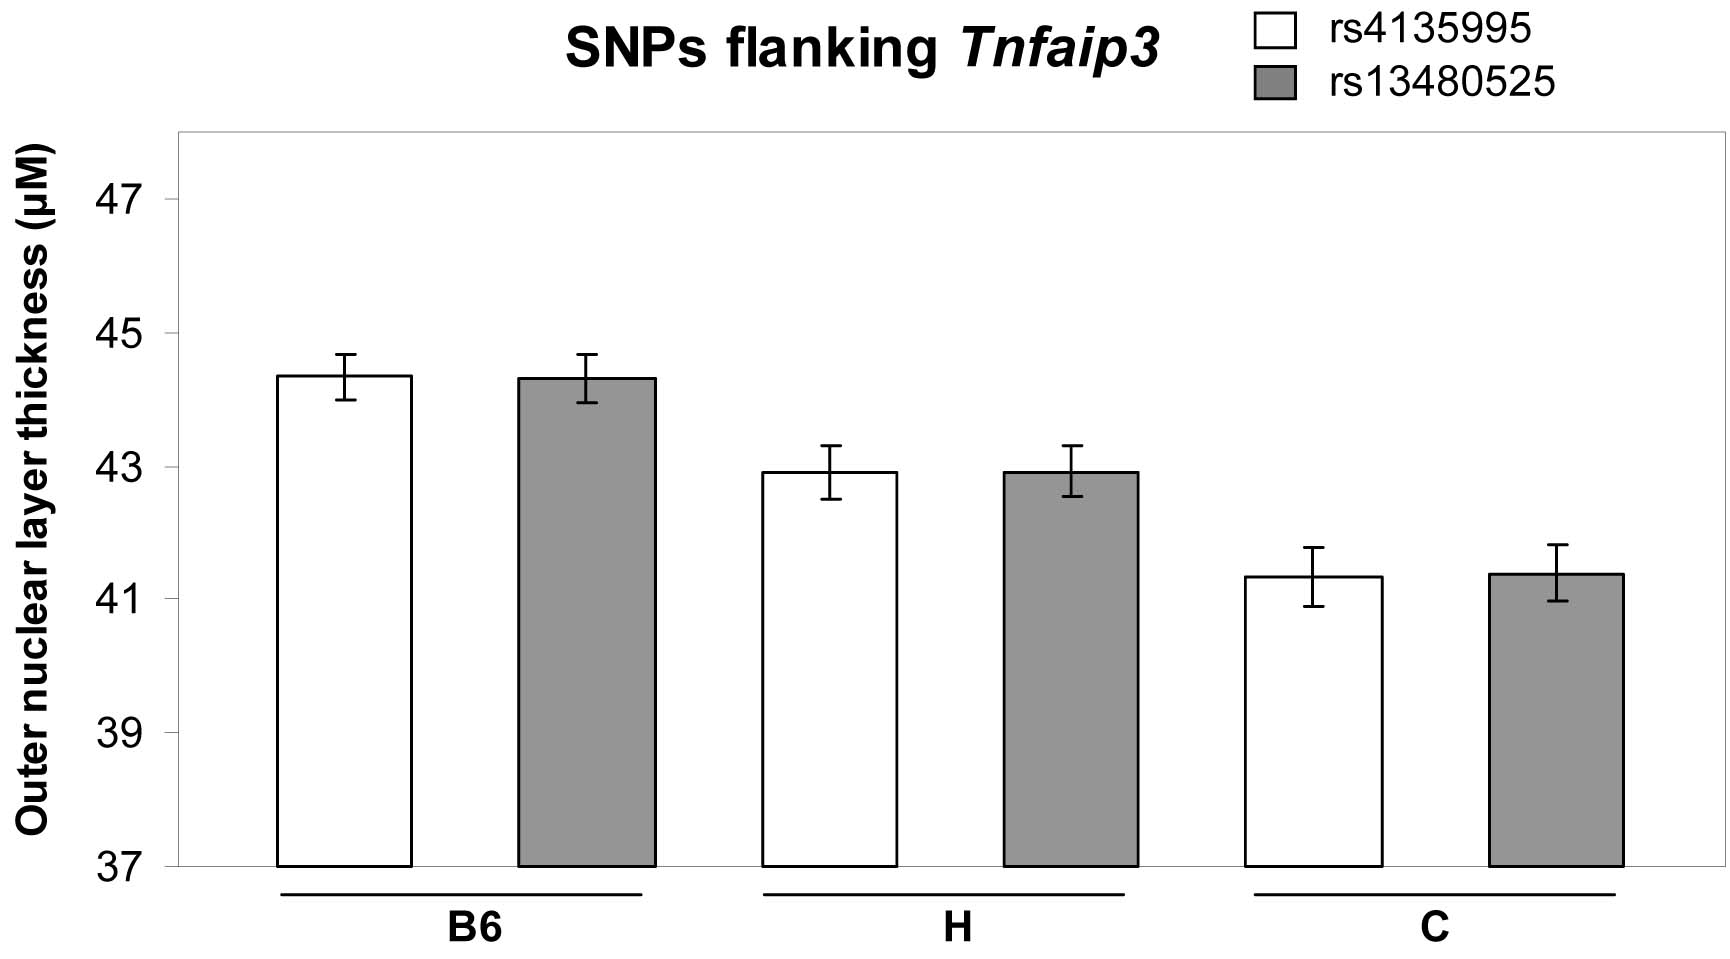
Figure 2. Analysis of SNPs flanking
Tnfaip3.
The
outer
nuclear
layer thickness data were obtained from our previous
study [
5]. The
phenotype of F2 animals (n=60), sorted by the genotype of two single
nucleotide polymorphisms (SNPs) flanking
Tnfaip3, is shown. The
outer nuclear layer thickness of the B6, H (heterozygous), and C
alleles for these two SNPs are significantly different (p<0.001).
Mean and standard error of the mean are shown.
 Figure 2 of Ogando, Mol Vis 2010; 16:1004-1018.