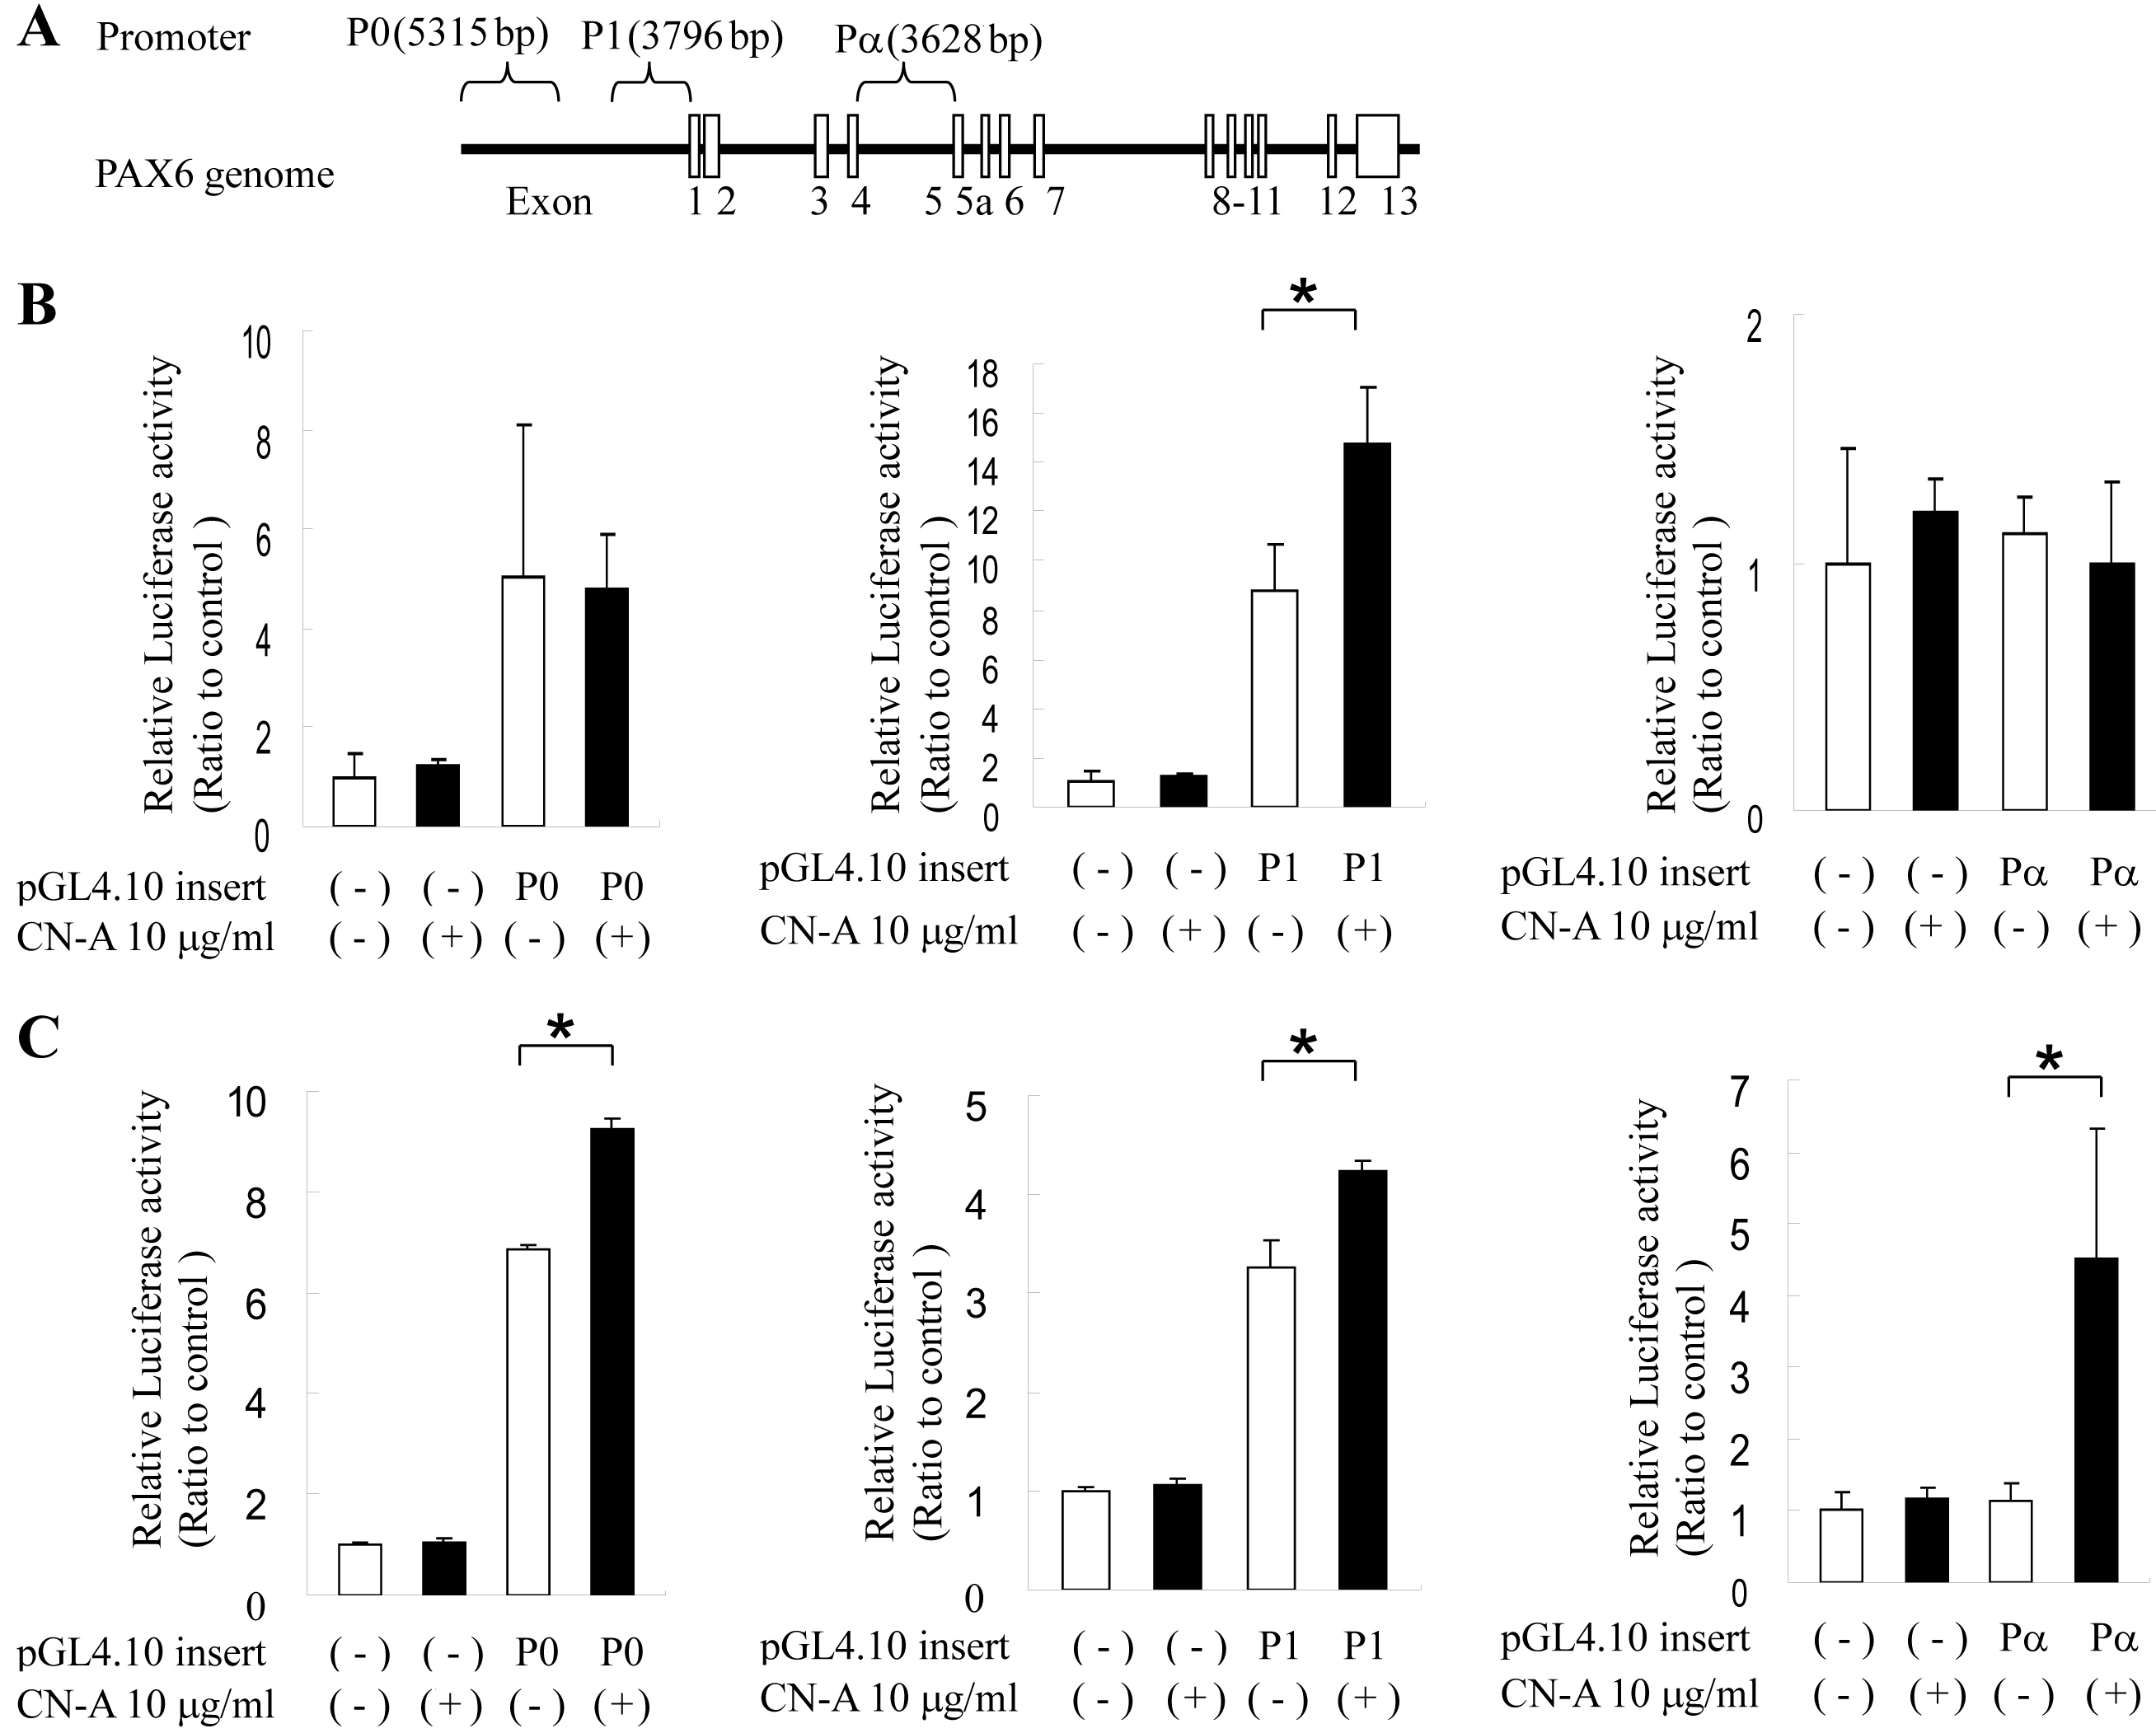
Figure 5. Luciferase assay of paired box
gene 6 (PAX6) promoter activity. A: Schematic indicates the
representation of the PAX6 transcript unit in humans. The boxes denote
exons. Braces indicate the extent of P0, P1, and Pα promoters in the PAX6
gene area. B: Luciferase assay of P0, P1, and Pα promoter
activity in Y-79 cells. C: Luciferase assay of P0, P1, and Pα
promoter activity in WERI cells. P0 of pGL4.10 insert indicates the
insertion of P0 promoter sequences (5315 bp), P1 promoter activity
(3796 bp), and Pα promoter sequences (3628 bp). White and black squares
indicate the no-CN-A treatment and CN-A treatment, respectively. The
negative pGL4.10 insert indicates an empty sequence. The data are
presented after normalizing transfection efficiency using the Renilla
luciferase reporter gene (n=3); the error bar indicates the standard
deviation; Mann–Whitney U-test, *p<0.05.

 Figure 5 of Kashiwagi, Mol Vis 2010; 16:970-982.
  Figure 5 of Kashiwagi, Mol Vis 2010; 16:970-982.