Figure 4. Expression of mRNA and protein
in retinoblastoma cells. A: Some gene mRNA expression was
investigated using reverse transcription polymerase chain reaction
(RT–PCR). Cells were treated with or without 10 μg/ml cotylenin A
(CN-A) for 3 days. The numbers (0, 10, and 20) indicate CN-A
concentrations (μg/ml). β-Actin mRNA was used as an internal
control. B: Some protein expression was investigated using
western blot analysis in retinoblastoma cells. Cells were treated with
or without 10 μg/ml CN-A for 5 days. “Cont.” indicates the
non-treatment. “CN-A” indicates the CN-A treatment (10 μg/ml).
β-Tubulin protein was used as a loading control. C: The bar
graph indicates the PAX6 protein expression (n=3); the error bar
indicates the standard deviation.
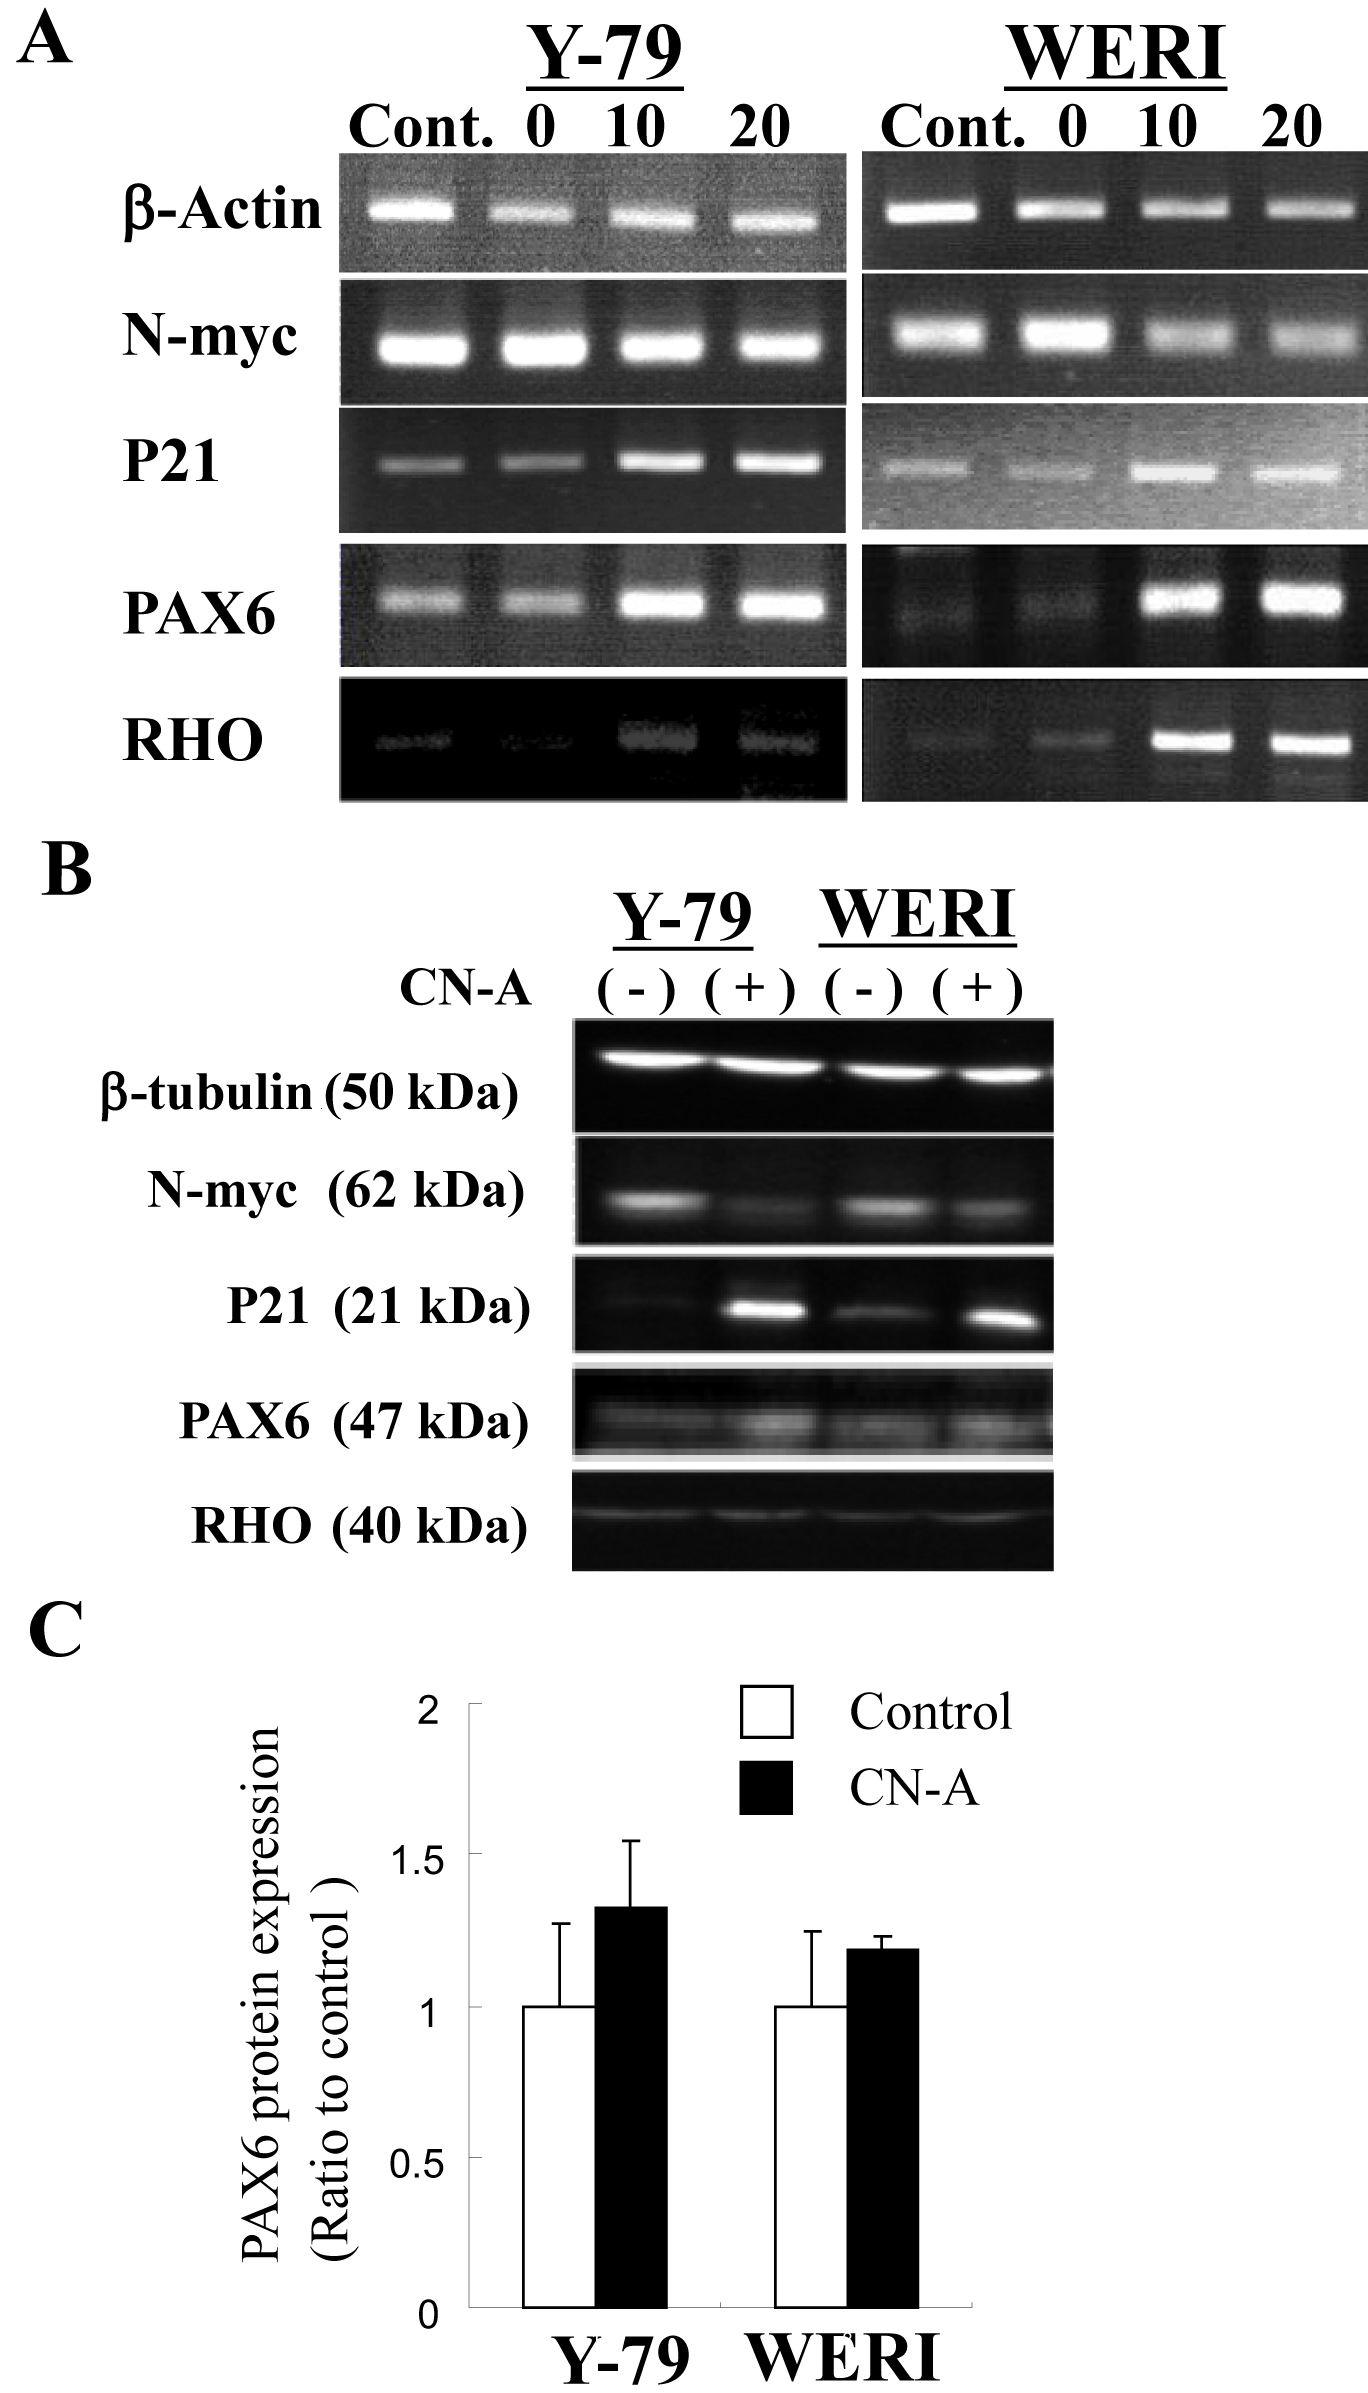
 Figure 4 of Kashiwagi, Mol Vis 2010; 16:970-982.