Figure 3. Photographs of the morphology of
retinoblastoma cell lines with and without cotylenin A. A:
Photographs indicate morphology of retinoblastoma cells with or without
10 μg/ml CN-A for 2 days. The bars indicate the length of 25 μm. B:
The
graph indicates the percentage of the dendrite-like process cells
(mean±SD, n=3). Asterisks indicate significant differences when
compared with the control without CN-A (*p<0.05).
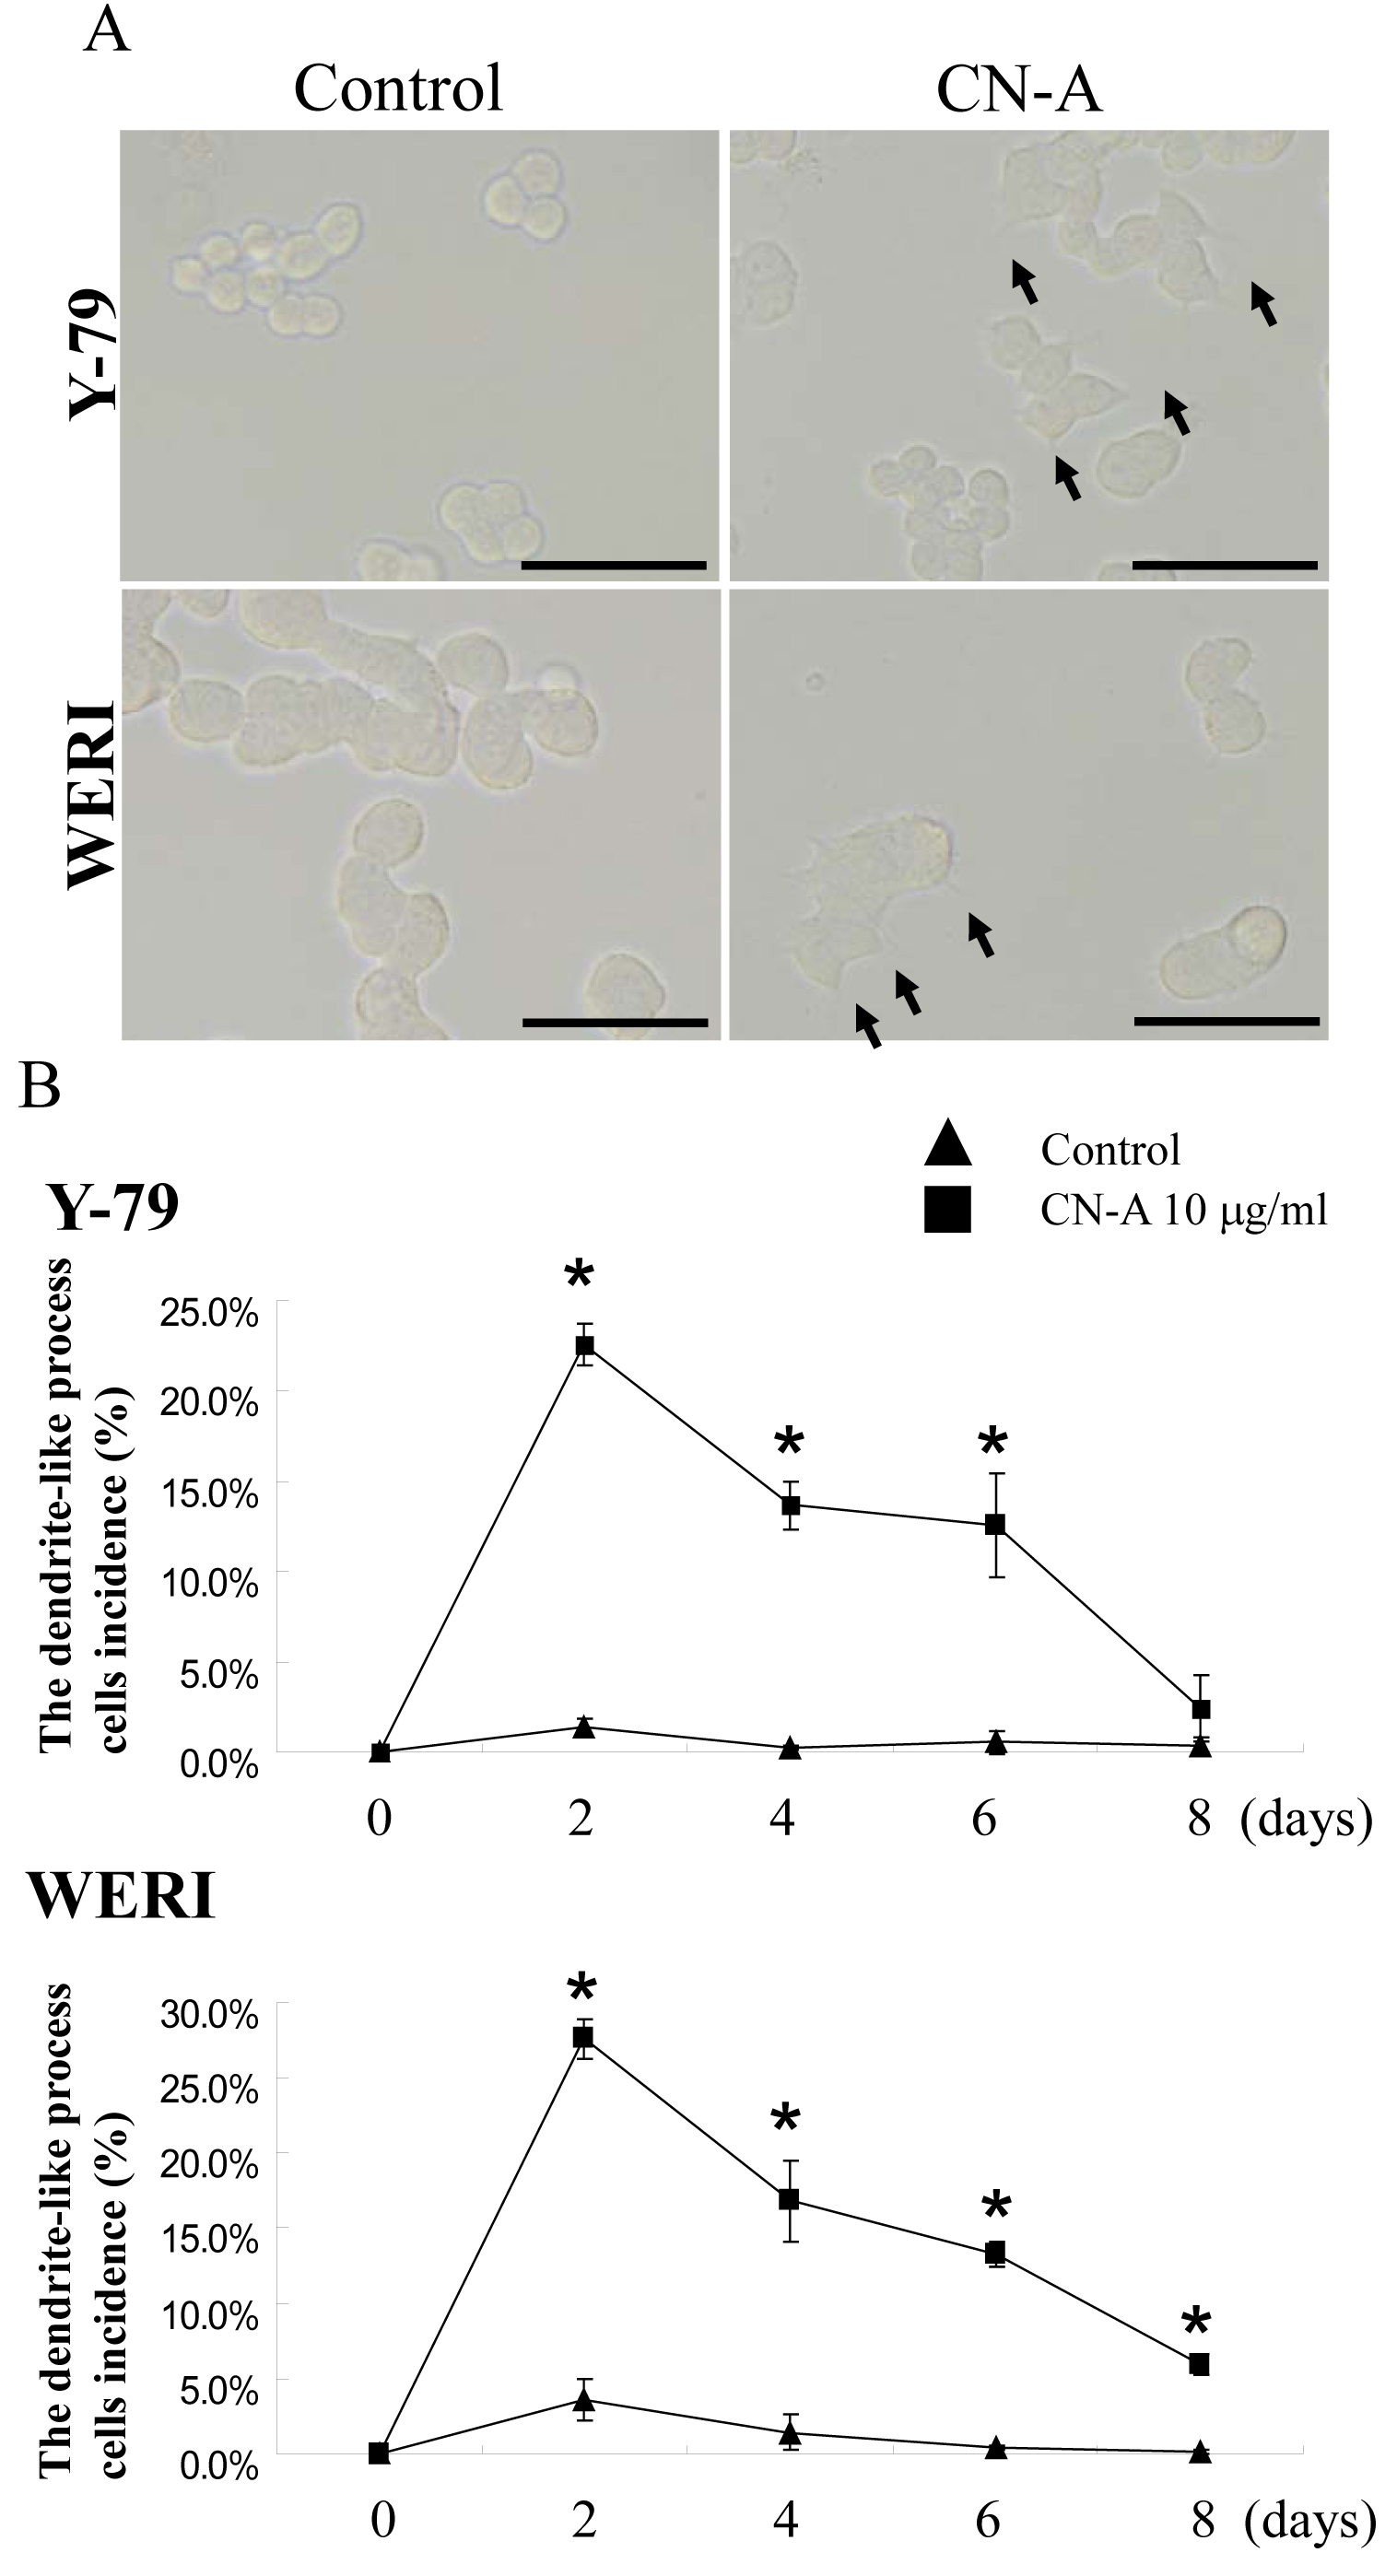
 Figure 3 of Kashiwagi, Mol Vis 2010; 16:970-982.