Figure 2. Response of cotylenin A on cell
death and apoptosis in retinoblastoma cell lines. A: Detection
of apoptosis using a terminal deoxynucleotidyl transferase deoxyuridine
5′-triphosphate (dUTP) nick-end labeling (TUNEL) assay. Cells were
treated with or without 10 μg/ml cotylenin A (CN-A) for 7 days. The bar
represents 25 μm. The arrow points to TUNEL-positive cells. B:
The bar graph indicates the percentage of TUNEL-positive cells.
Asterisks indicate significant differences when compared with the
control without CN-A (p<0.05; C) the bar graph and
electrophoresis photographs indicate the protein expression of cleaved-
Poly Adenosine diphosphate –ribose polymerase (PARP) in retinoblastoma
cells. The bar graph indicates C-PARP protein expression (n=3); the
error bar indicates the standard deviation. Asterisks indicate
significant differences when compared with the control without CN-A
(p<0.05).
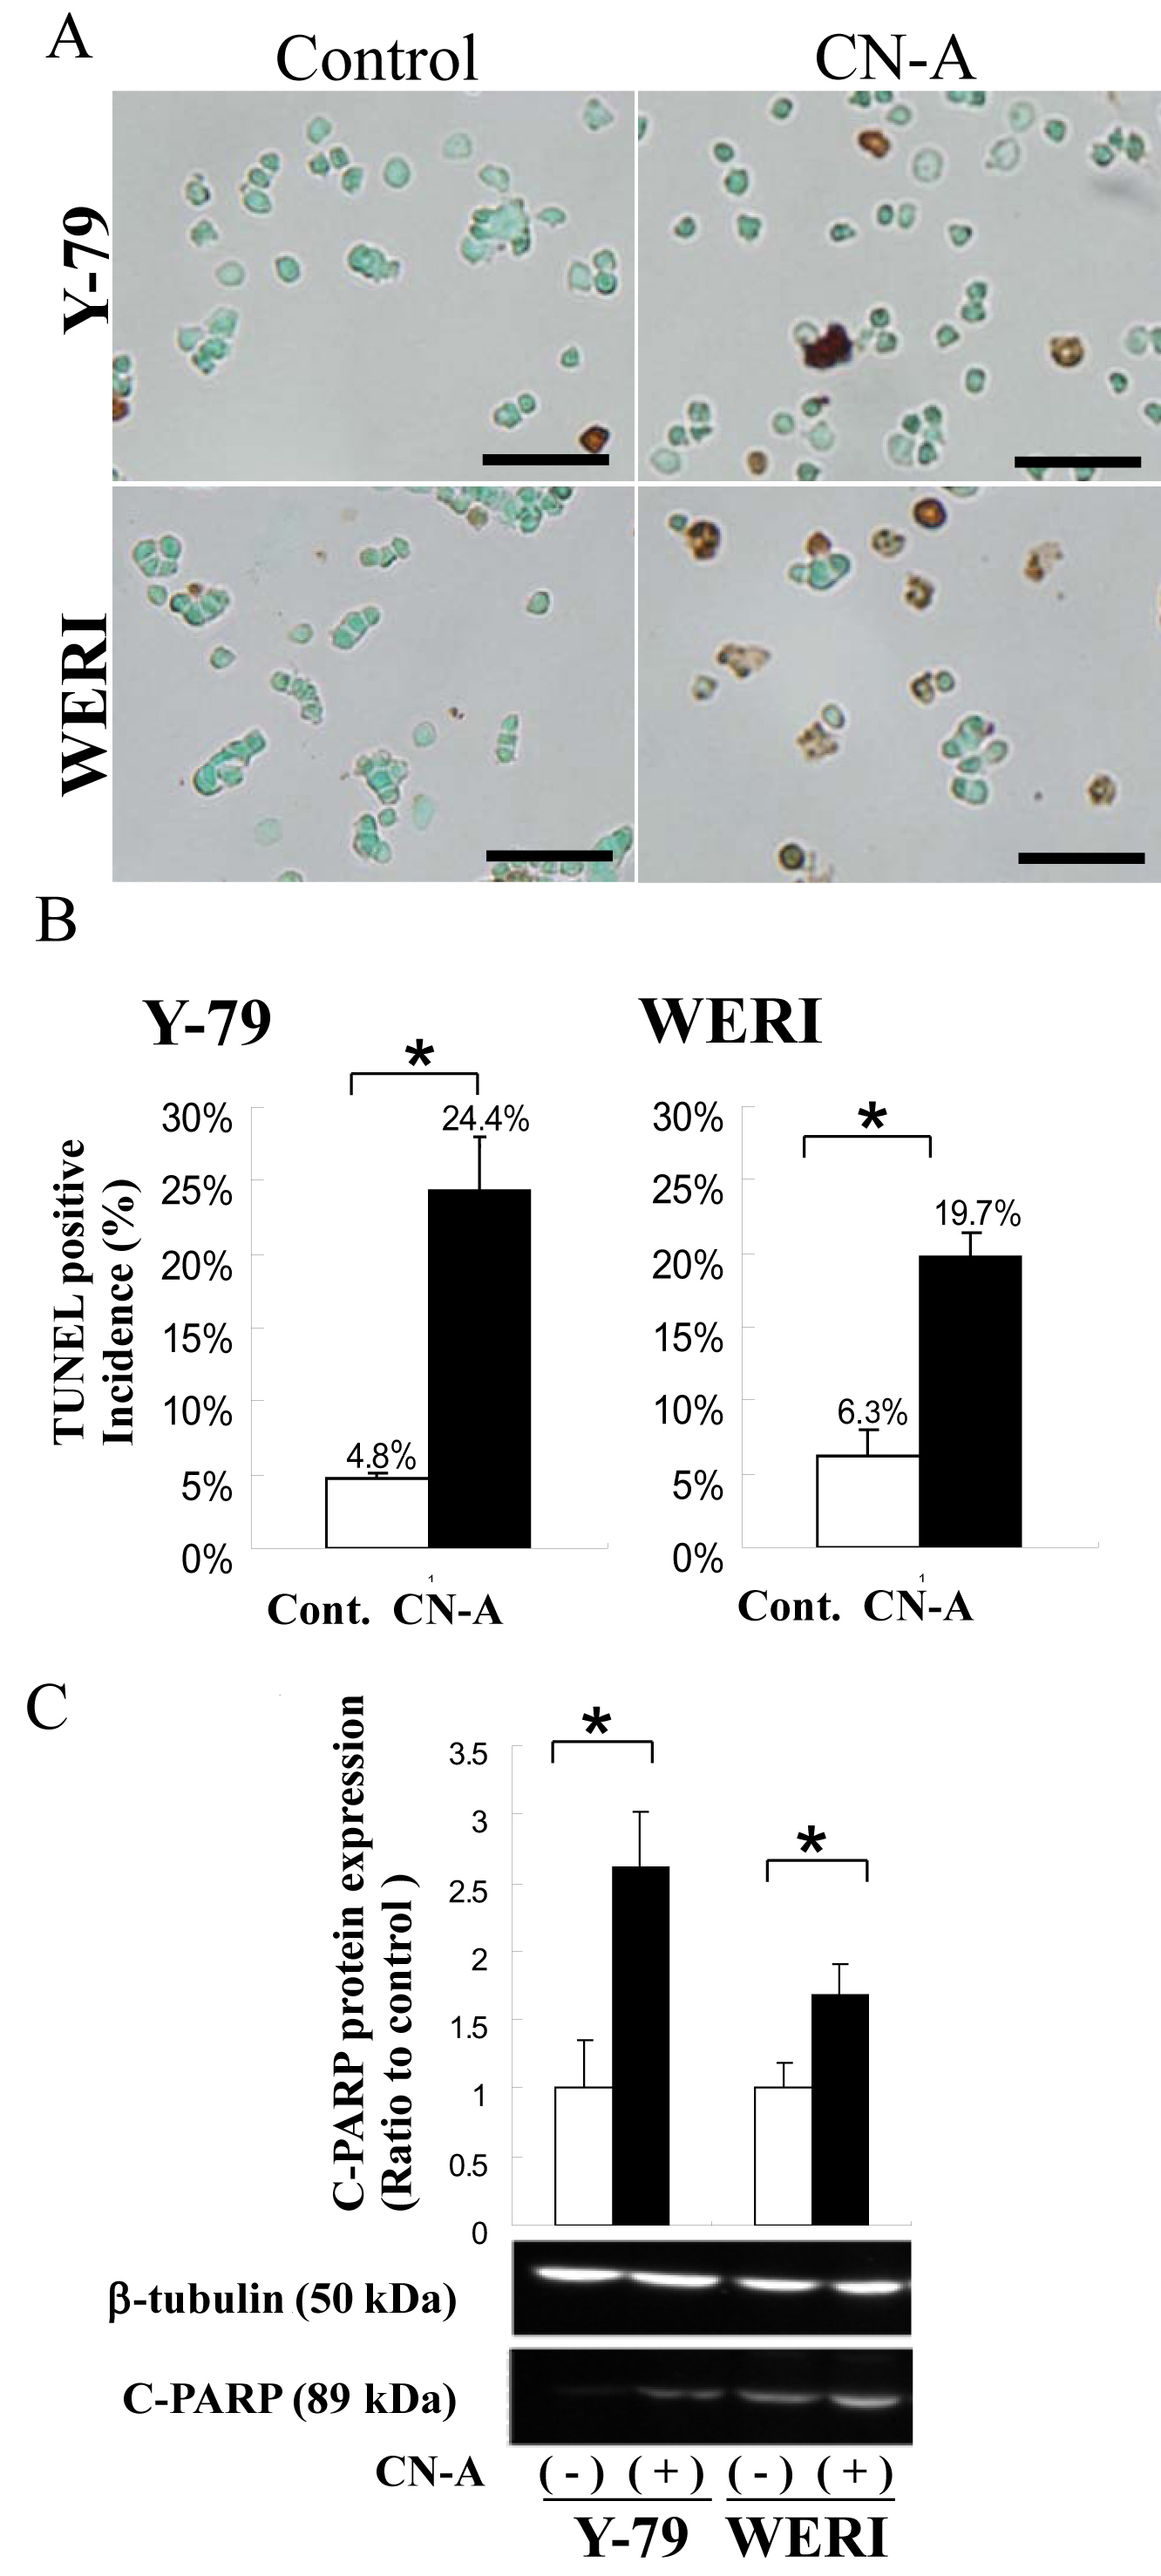
 Figure 2 of Kashiwagi, Mol Vis 2010; 16:970-982.