Figure 6. Semiquantitative reverse
transcriptase (RT)-PCR analysis. The expression of the stem cell
markers ATP-binding cassette transporter G2 (ABCG2), cell
surface antigen Sca-1, p75 neurotrophin receptor (p75NTR), β-1
integrin, B-cell lymphoma 2 (Bcl2), and nestin in SP and non-SP
cells was analyzed by semiquantitative RT-PCR. Open bars indicate mRNA
levels in non-SP cells; gray bars indicate mRNA levels in SP cells. SP
cells express more ABCG2 than non-SP cell. All stem cell
markers were expressed at higher levels in SP cells than non-SP cells.
Stem cell antigen 1 was expressed at 26 fold higher levels in SP cells
than in non-SP cells.
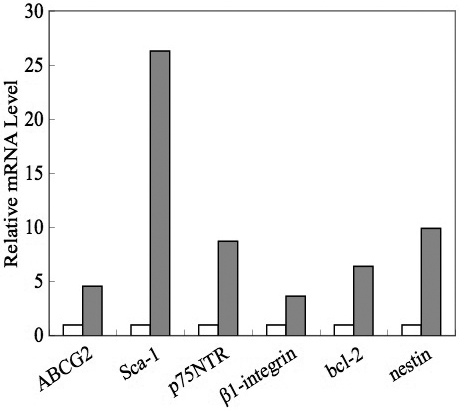
 Figure 6 of Oka, Mol Vis 2010; 16:945-953.